
















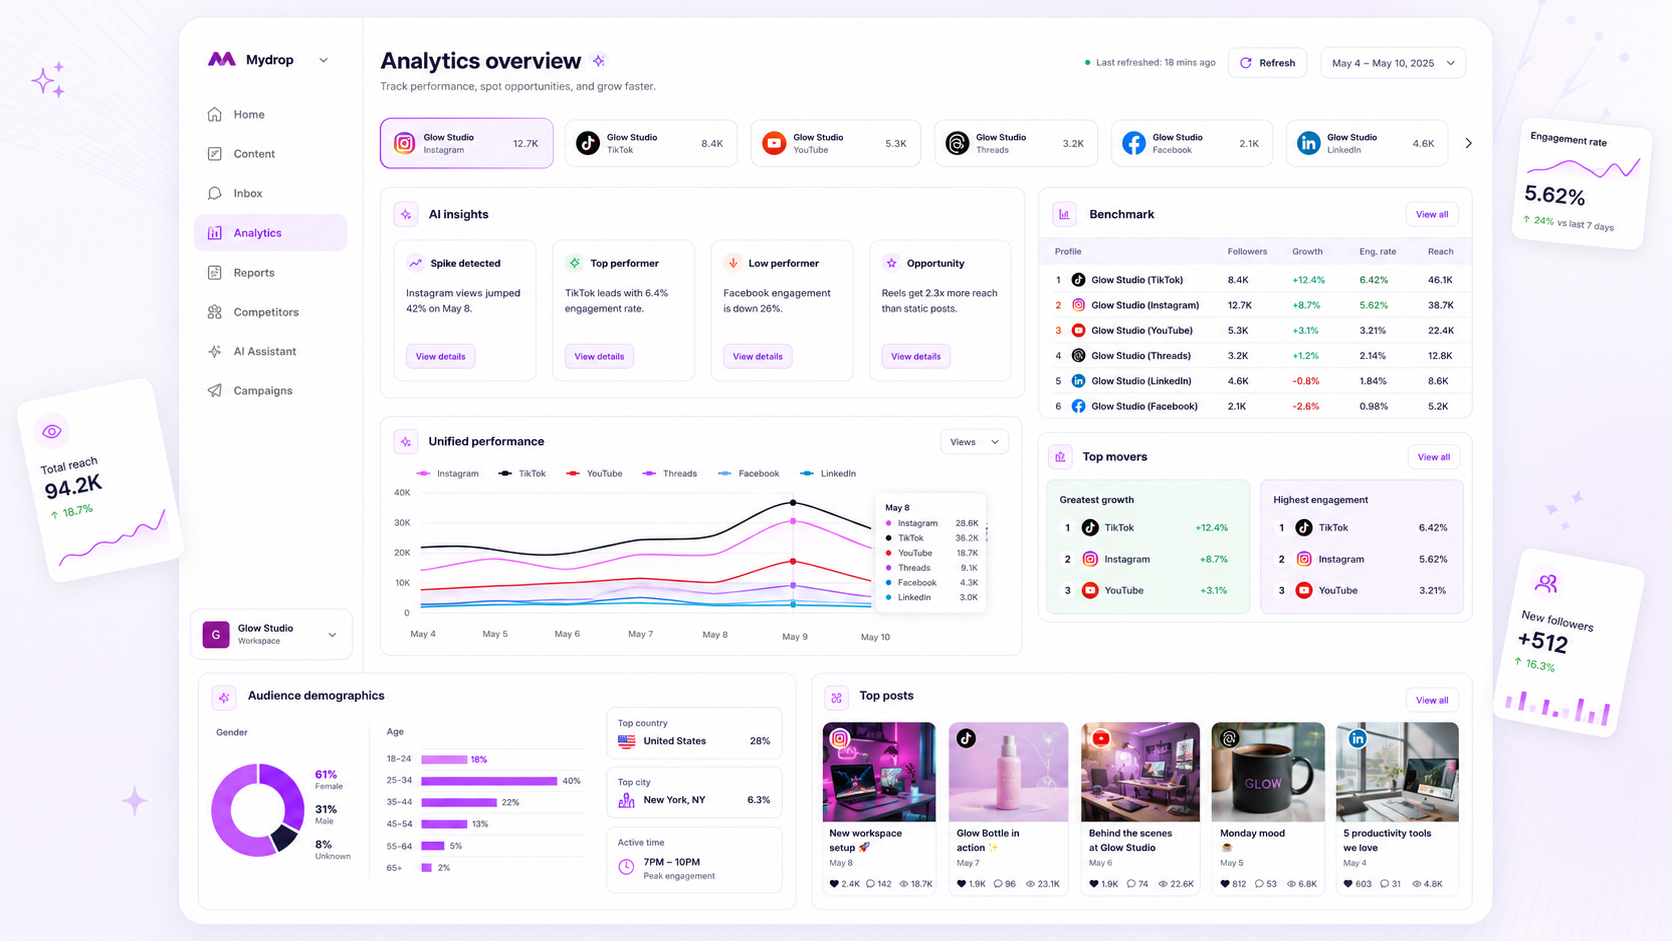
To spot analytics gaps across profiles, divide each account's engagement rate by a fair reference point (its own 90-day median and the platform median), then rank the ratios. The account at the bottom of that ranking is the real gap, not the one with the fewest followers. This scorecard takes about an hour for 3 to 12 profiles.
TLDR: Raw numbers hide gaps because accounts differ in size. Pull 90 days of posts per profile, work out the engagement rate, divide by the platform median, then flag accounts under 0.7x and dig into the cause before changing anything.
Why raw numbers mislead
A flagship account with 200,000 followers will always show bigger totals than a local brand with 4,000. Ranking by totals just tells you who is big. Worse, big accounts often coast on old momentum while a small account does the real work for its size.
Engagement rate removes size. It is still not perfect, so we add a second step: compare to a reference point.
Step 1: pull the same three columns for every profile
Use the same window (the last 90 days) and the same three numbers per profile and platform.
- Posts published
- Median engagement rate per post (use the median, not the average, so one viral post does not skew it)
- Median reach or views per post
Mydrop's multi-profile benchmark puts these side by side for every connected profile, so you do not export five spreadsheets and line them up by hand.
Step 2: choose the reference line
Use a platform median as your first line. In Mydrop's data, the median engagement rate per post was 3.1% on Instagram, 3.0% on TikTok and 1.1% on Facebook, and half of Instagram posts landed between 1.1% and 6.7%. So a 2% Instagram post is normal, not a failure.
Then add a second line, your own portfolio median across all profiles on that platform. A profile can beat the platform median and still be the weakest in your group, and that is the one your client will notice.
Step 3: build the scorecard
Divide each profile's median engagement rate by the platform median.
| Profile | Platform | Median rate | Platform median | Index | Flag |
|---|---|---|---|---|---|
| Brand A | 4.2% | 3.1% | 1.35 | Strong | |
| Brand B | 2.9% | 3.1% | 0.94 | Normal | |
| Brand C | 1.4% | 3.1% | 0.45 | Gap | |
| Brand D | 0.8% | 1.1% | 0.73 | Watch |
(Numbers in this table are an illustration of the method, not real accounts.)
Index under 0.7 means investigate. Between 0.7 and 1.3 means leave it alone. Over 1.3 means find out why and copy it.
Step 4: diagnose the gap before fixing it
A low index has a few common causes. Check them in this order, cheapest first.
- Posting rhythm. Long gaps or irregular posting. Look at posts per week.
- Timing. Posts landing in the audience's night. In our data, midnight to 6 am local time ran 17% below median across platforms.
- Format mix. One format everywhere. Try carousels on the weakest account first.
- Audience mismatch. The account grew through a giveaway or a tool that brought the wrong followers. This one takes longer to fix.
Fix one cause per account per month, then re-score. Change four things at once and you will never know which one worked.
Step 5: turn the scorecard into a client report
Gaps are only useful if someone acts on them. Add one sentence per profile: what the index is, the likely cause, the one change planned. A white-label PDF report with a scheduled delivery gives clients that view monthly without anyone rebuilding it.
Agencies managing many accounts can also use the scorecard to decide where the hours go. The 0.45 account needs a rescue plan. The 1.35 account needs a protect-and-copy plan. Everyone in the middle needs consistency. See Mydrop for agencies for how teams run this across client workspaces.
Your next step: pick your three most important profiles and fill in the scorecard this week. One hour is enough to find your first gap.


 Google review
 Trustpilot review
 Product Hunt comment





