

















Automation should take over everything that stays the same every month: pulling the numbers, laying them out, sending the file. It should never write the part that explains what happened. The split is simple: machines own the numbers, you own two sentences of meaning.
TLDR: Automate collection, charts and delivery. Keep a fixed commentary block of two sentences per report: what moved, and what you'll do about it. A report with numbers and no context gets skimmed, a report with both gets used.
Decide what is automated and what stays human
Draw the line before you build anything.
| Part of the report | Automate? | Why |
|---|---|---|
| Pulling metrics from each platform | Yes | Same work every time, easy to get wrong by hand |
| Charts and layout | Yes | A fixed template keeps reports comparable |
| Sending on a schedule | Yes | Late reports erode trust fastest |
| What changed and why | No | Needs knowledge of campaigns, launches, outages |
| What happens next | No | A decision, not a calculation |
If a step needs someone to know that "the sale started Tuesday" or "the Instagram connection broke for two days", it needs a person.
Choose four to six metrics and pin each to a goal
Context dies when a report shows 30 numbers. Pick a handful and say what each one is for.
- Reach or impressions for awareness goals.
- Engagement rate for content quality. In Mydrop's data, the median Instagram post sat at 3.1%, so a 2% post is normal.
- Clicks or link-in-bio visits for traffic goals.
- Followers gained, only if growth is a stated goal.
Each metric shows the change against last period and a target if you have one. If a number has no goal behind it, remove it.
Add a commentary block that cannot be skipped
This is the part that keeps context. Put two fixed prompts at the top of every report:
- What moved, and the likely reason. "Reach up 18% because the Thursday carousel was shared widely."
- What we do next. "Repeat the format twice next month."
Two sentences take under five minutes. Make the block mandatory in your workflow, and a report with an empty box does not go out.
Also add a campaign tag to posts when you schedule them. Months later, the tag tells you what a spike was, without anyone needing to remember.
Set up scheduled delivery in Mydrop
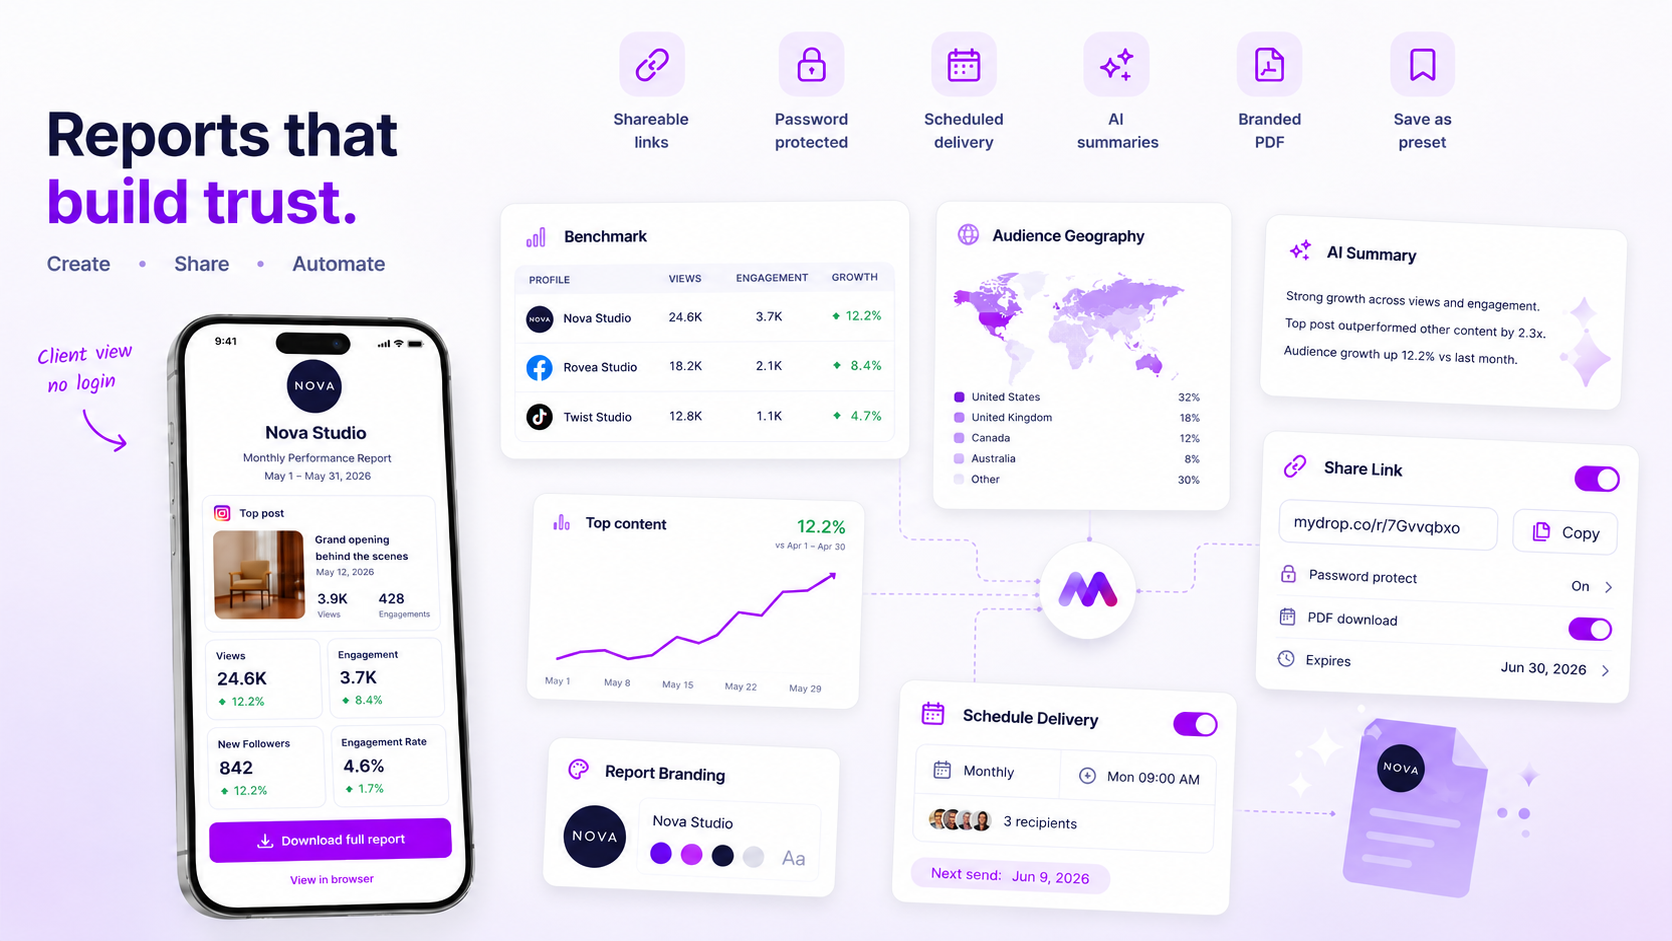
Mydrop's reports build white-label PDFs, share them by link and send them on a schedule, so the data side runs without you. The performance view uses native per-platform metrics, such as YouTube watch time, Pinterest saves and LinkedIn seniority breakdowns, so reports are not limited to likes and reach.
A practical setup for an agency or in-house team:
- Build one template per client or brand, with the same four to six metrics.
- Schedule delivery for the second working day of the month.
- Open the draft the day before, add the two-sentence note and send.
For multi-client work, Workspaces keep each brand's data and report separate.
Check the report is read, not just sent
Once a quarter, ask the recipient one question: "What did you do after reading this?" If the answer is nothing, the report is a ritual. Cut a metric, sharpen the note, or change what it is for.
For metric selection, see four metrics that prove ROI. For a whole system, follow the reporting workflow guide.
Next step: pick your most time-consuming report, list its metrics, cut it to six and write the commentary prompts into the template before the next send.


 Google review
 Trustpilot review
 Product Hunt comment





