
















Stop copy-pasting screenshots into slide decks. If you spend the first three days of every month pulling platform data by hand and formatting it to match a brand, you're not doing analytics. You're doing very expensive data entry.
We get it. You want to give your clients deep, insightful analysis, but the messy middle of gathering metrics across five different platforms turns your Friday afternoon into a spreadsheet-filled nightmare. It's the repetition that's wearing you down, not the strategy. The good news? Standardised, template-driven automation is the only way to scale agency reporting without sacrificing the narrative quality your clients actually pay for.
Switch to a preset-based rhythm and you stop chasing numbers and start delivering insights.
The operating problem this solves

The real enemy of a good analytics practice is coordination debt. Every time you compile a report by hand, you're effectively paying a "spreadsheet tax" on your team's capacity. You're probably rebuilding the same slide deck structure, reapplying the same brand colours and recalculating the same platform-specific metrics for every single client. That's not just inefficient. It's a fragile, error-prone process that falls apart the moment a client asks for a custom date range or a specific platform breakdown.
When you're managing dozens of brand profiles across multiple markets, manual reporting creates a massive bottleneck. The team gets stuck in a cycle of "export and paste" instead of "review and refine."
Think about how the time actually gets spent across a typical monthly cycle:
| Activity | The Manual Slog | The Automated Cadence |
|---|---|---|
| Data Aggregation | 4-6 hours (platform hopping) | 0 hours (system sync) |
| Formatting/Branding | 2-3 hours (per report) | 0 minutes (template apply) |
| Narrative Synthesis | 1 hour (reactive) | 30 mins (proactive/AI check) |
| Stakeholder Review | 1 hour (email chains) | 5 mins (link delivery) |
| Total Per Client | 8-11 hours | < 45 minutes |
The maths is simple: save eight hours per report across a portfolio of twenty clients and you win back nearly two hundred hours of billable, creative time every month.
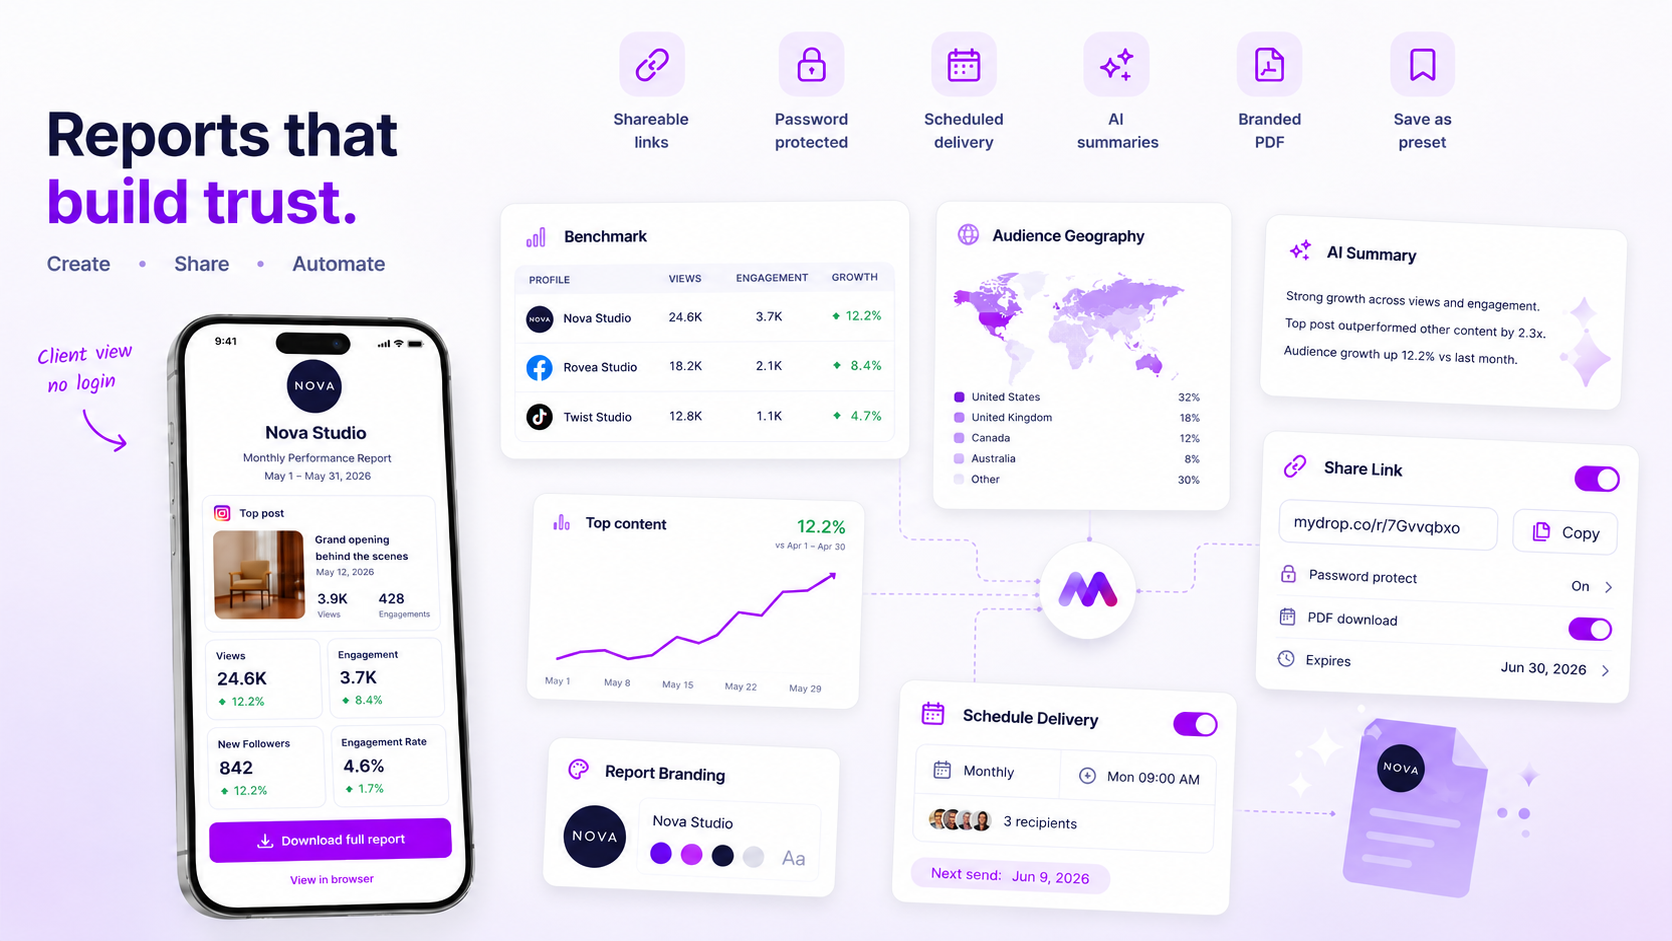
Most teams don't have a data problem. They have a decision bottleneck. They're so focused on the act of reporting that they never stop to curate what actually matters. When you use an automated system, like the report builder in Mydrop, you're not just saving time on exports. You're enforcing a standard of quality. With reusable presets, every client report, whether it's for a boutique brand or an enterprise account, follows the same professional structure, branded correctly, every single time.
You move from "Did we capture the right screenshot?" to "What story does this data tell?"
The minimum system that works
The secret to sane reporting is simple: stop building, start applying. If you're hunting for a logo, manually recolouring charts to match a client's style, or deciding which metrics to include for the third time this week, your workflow is fighting you. A minimum viable system relies on one thing: a reusable template.
In Mydrop, we suggest teams treat their first report as a prototype. Pick your profiles, define your date range, select the top-line metrics that actually drive business conversations, and apply your agency branding once. Then save it as a preset. From that point on, you're not "building" a report. You're simply hitting "apply" and letting the system fill in the data.
Here's what your core configuration should look like to keep things lean:
| Component | Minimum Requirement | Why it matters |
|---|---|---|
| Data Scope | Fixed profile groups | Removes the need to manually toggle accounts every time. |
| Date Preset | Last Month or Last 7 Days |
Ensures a consistent, reliable look-back period. |
| Branding | Logo + Brand Colors + preparedBy |
Shifts the report from "raw data" to "client-ready asset." |
| Sections | 3-4 high-impact widgets | Prevents data overload; keeps clients focused on outcomes. |
| Narrative | AI-generated summary | Gives the client the "so what" before they look at charts. |
Operator rule: If a section in your report doesn't lead to a question from your client, remove it. Reporting should be a conversation, not a data dump.
Where teams overbuild the process
Most reporting systems eventually collapse under the weight of "just one more chart." We've seen teams at large agencies create 40-page PDFs that no one reads, simply because they're afraid to leave a metric out. This is a classic case of coordination debt: you're spending hours perfecting a document to prove your worth, when the client really just wants to know if they're hitting their targets.
The trap is believing that more data equals more value. In reality, a massive report is often just a mask for a lack of clear strategy. When you force your team to build custom, bespoke reports for every single stakeholder, you're not being "high touch". You're creating a bottleneck.
The most common failure mode we see is the "kitchen sink" approach:
- Adding every available metric: Including reach, engagement, sentiment and clicks for every platform, even if they aren't relevant to the current campaign.
- Infinite customisation: Adjusting font sizes, chart types or colour palettes for individual clients instead of keeping a consistent brand standard.
- Manual post-processing: Exporting data, cleaning it in a spreadsheet, then importing it into a slide deck.
At Mydrop, we recommend establishing a standard "core" report that covers 90% of your clients' needs. If a client needs something special, that's the exception, not the rule. If the exception becomes the standard, you've got a process problem, not an analytics problem.
Common mistake: Treating report design as a creative exercise. Your report should be a utility, like a utility bill or a bank statement: boring, predictable and immediately understandable.
Standardise the layout and automate the production, and you free your team to focus on the remaining 10%: the actual human analysis that explains why the numbers moved. That's where you earn your retainer, not in the formatting of a PDF.
How to run the cadence
Once your presets are locked in, the goal is to shift from "project manager" mode to "quality control" mode. Automation isn't about removing human oversight. It's about giving yourself the headspace to actually look at the data instead of just moving it around.
At Mydrop, we suggest a simple three-step monthly rhythm to keep your reporting meaningful without it becoming a drain on resources:
- Trigger the Run: On the first working day of the month, open your report preset. It should already have the right profiles, section order and branding snapshots selected. Just update the date range to
lastMonthand hit generate. - Review the AI Narrative: Since your report builder includes automated summaries, spend your energy here. Check that the AI-highlighted trends match the actual campaign sentiment. If a specific post went viral for reasons the data doesn't fully capture, add a two-sentence note to the report narrative to bridge that gap.
- Delivery and Archive: Once the branded PDF is generated, download it or deliver it through your internal portal. Because the report run is stored, you have a permanent, durable record of exactly what the client saw, which is invaluable if you ever need to revisit historical performance months down the line.
Decision check: If you find yourself manually editing more than 20% of the report content after generating it, your template is too generic. Update your preset to include the specific metrics or post-list filters you keep adding by hand every time.
The proof that the habit is working
How do you know you've successfully moved from data entry to analysis? You'll see a tangible shift in how your team spends their time and how your clients respond to the material. Once the spreadsheet tax is gone, the conversation changes from "why did these numbers drop?" to "what should we do differently next month?"
Here's a simple way to score your progress:
| Activity | The Old Way (Manual) | The New Way (Automated) |
|---|---|---|
| Data Aggregation | 4-6 hours per month | 5 minutes (Preset run) |
| Styling & Formatting | 2-3 hours per month | 0 minutes (Branding lock) |
| Strategic Insight | 30 minutes (After exhaustion) | 90+ minutes (Fresh focus) |
| Report Consistency | Fragmented / Human error | 100% standardized |
If your team is spending less than 10% of their reporting time on formatting and data assembly, you've hit the efficiency sweet spot. You're not just saving time. You're protecting your team from the burnout that comes with repetitive, low-leverage tasks.
Conclusion
The messy middle of agency reporting isn't an inevitable part of the job. It's a coordination failure. When you treat reports as durable, repeatable assets rather than one-off documents, you stop losing hours to the grind.
Take this week to build your first three core presets: perhaps one for your high-growth accounts, one for maintenance clients and one for experimental campaigns. Once you move from manual creation to template-driven delivery, you'll find that the real value of your analytics isn't the report itself. It's the time you've bought back to actually improve the results inside it.
 Google review
 Trustpilot review
 Product Hunt comment





