
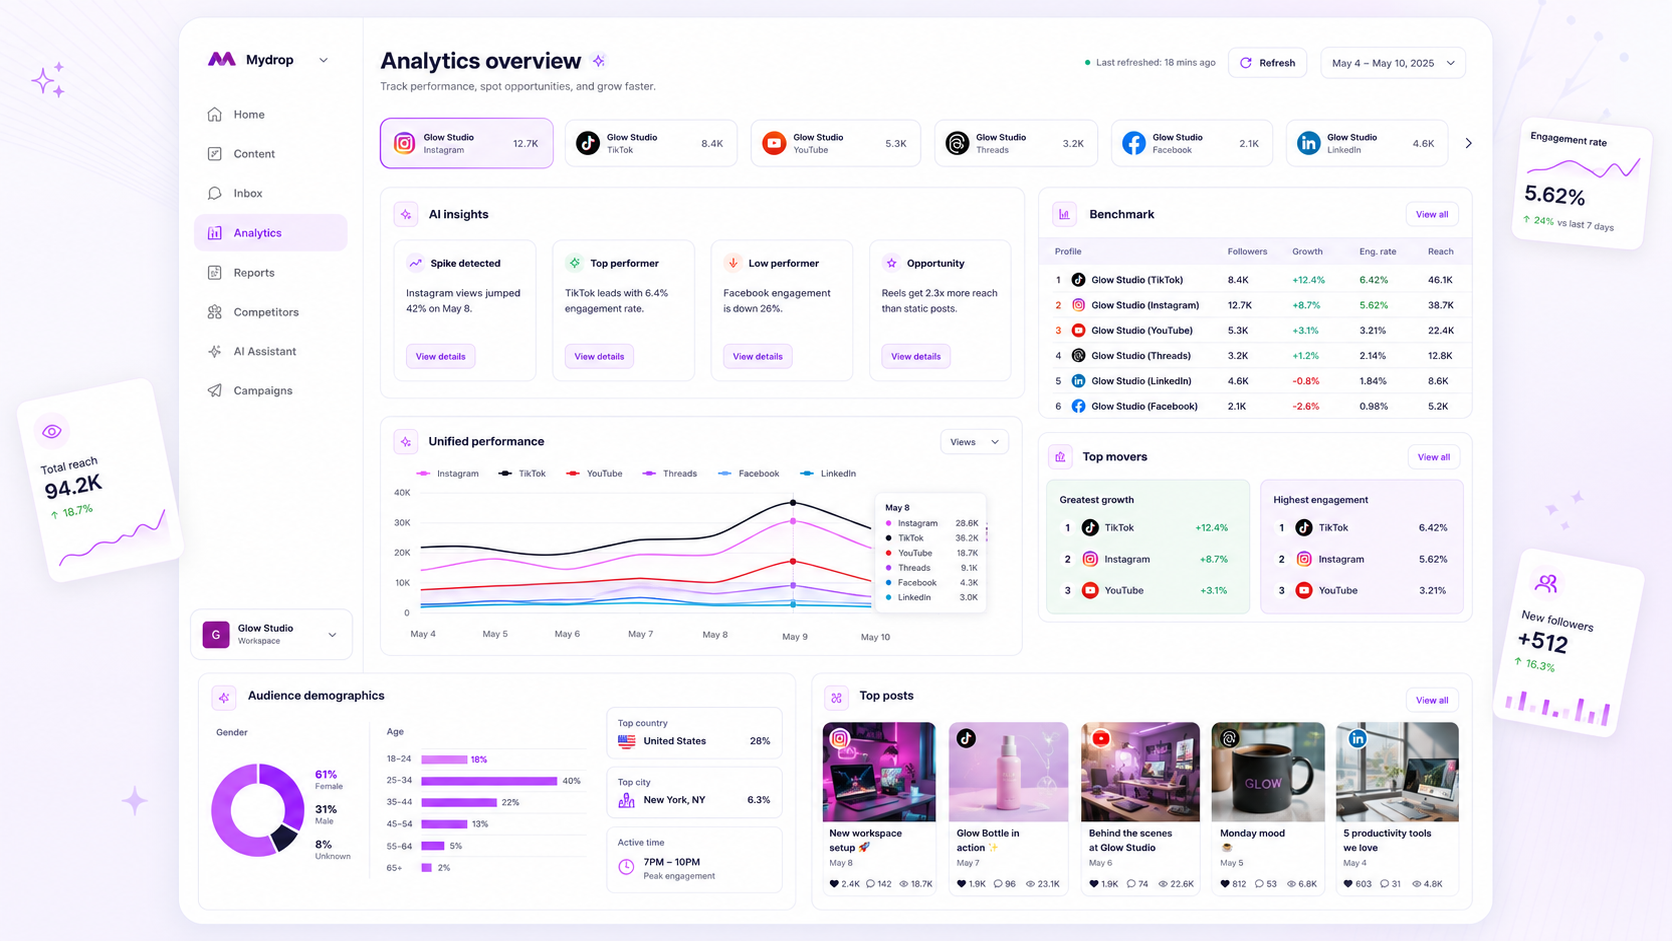
The best social media analytics tool for agency benchmarking is the one that forces disparate metrics into a unified, refreshable, and strictly comparative framework. Most teams treat analytics like a filing cabinet: you open it, pull out a few dusty files, and hope they tell you something relevant by the time you reach the boardroom. But if your analytics tool is not actively aggregating data across every client profile you manage, it is not helping you benchmark; it is just acting as a very expensive document storage service. We know the drill: your week becomes a fragmented cycle of opening ten different platform dashboards, exporting CSVs, and trying to map TikTok reach against LinkedIn impressions. It is messy, it is manual, and it keeps you stuck in the weeds when you should be planning the next pivot. Your stack should be a catalyst for faster iteration, not a bottleneck for your team's strategy.
What the best tools need to handle

When you support dozens of clients across five platforms, you cannot afford to wait until the end of the month to see if a campaign is failing. The best tools recognize that social media success at scale is about coordination speed, not just reporting depth. If you have to manually request a data refresh or wait for a scheduled export to clear, you are already operating on stale information.
Here is how high-performing teams distinguish between a basic reporter and an agency-grade benchmarking tool.
The Benchmarking Readiness Scorecard
| Feature | Static Reporting Tool | Dynamic Benchmarking |
|---|---|---|
| Data Freshness | On-demand or weekly | Daily automated sync |
| Metric View | Per-profile silos | Cross-profile aggregation |
| Normalization | Manual Excel mapping | Automated metric mapping |
| Strategy Check | Monthly retrospective | Real-time outlier alerting |
To be effective, your tool must handle three core requirements.
First, it must normalize metrics across platforms. A like on LinkedIn is not the same as a like on TikTok, but your reporting should automatically translate these into comparable engagement rates. If the tool forces you to map those manually, you are wasting cycles on data hygiene instead of strategy.
Second, it must provide workspace-level visibility. When managing many brands, you need to toggle between a Retail client and a Tech client instantly. If you cannot see the delta between their performance trends without leaving your dashboard, you are losing the context necessary to make smart, informed revisions.
Third, it must enforce a benchmark threshold. You should be able to define what good looks like for a specific category and have the dashboard automatically flag profiles that are drifting away from that baseline. Without this, you are just looking at a dashboard of numbers without knowing which ones actually demand your attention.
This is where teams often hit a wall. In our experience, teams switch to Mydrop because the daily cached refresh eliminates that Sunday night anxiety of updating reports, allowing them to focus on the insights rather than the assembly. A tool should feel like a part of your team, not another client you have to manage.
Where basic tools start to break

Most teams realize their analytics tool is failing them when the spreadsheet has become a crime scene. You open ten different browser tabs, download raw CSV files from each platform, and start the grueling process of manual mapping.
The real issue here is not that the data is missing. It is that you are drowning in disconnected noise. Basic tools treat analytics like a filing cabinet: you open it, pull out a few dusty files, and hope they still represent reality. When you are managing dozens of client profiles, this is not just inefficient-it is a massive strategic bottleneck.
This is where "good enough" analytics breaks down:
- The Timing Gap: If your data is cached and stale, you are analyzing history, not performance. If a campaign dips on Tuesday and your tool does not trigger a refresh until Friday, you have lost three days of optimization.
- The Normalization Trap: You cannot compare TikTok "views" to LinkedIn "impressions" without a common language. If your tool forces you to do that normalization in your head or a side-sheet, you are doing the tool's job.
- The Coordination Debt: When access is siloed at the profile level, you cannot see the bigger picture. You end up with a team that knows everything about one client but nothing about the overall agency performance or cross-brand trends.
At Mydrop, we see teams struggle because they are stuck in this manual cycle. We designed our workspace analytics to handle this by refreshing data automatically across all connected profiles, ensuring you are always working from the latest available metrics without needing to trigger a manual download.
The buying criteria that matter
If you are evaluating tools, stop looking for "more integrations" and start looking for "better aggregation." A tool that connects to every platform but cannot compare them is just a data collector, not an analytics engine.
Use this matrix to determine if a platform is designed for your agency-grade needs or if it is just a glorified reporting export tool.
| Criteria | Basic Tools | Agency-Grade Benchmarking | Decision Rule |
|---|---|---|---|
| Data Aggregation | Manual CSV Export | Real-time Unified Workspace | If you spend >2 hours/week exporting, upgrade. |
| Refresh Frequency | Manual/Ad-hoc | Daily Automated | If data is >24h old, strategy is blind. |
| Metric Normalization | None (Platform-specific) | Unified (Cross-platform) | Must allow apples-to-apples comparison. |
| Alerting | Reactive (Manual check) | Threshold-based | Flag dips >15% vs 30-day avg. |
| Access Model | Per-profile siloed | Workspace-wide pooled | Need holistic view of all client sets. |
The Checklist for Agency Buyers
Beyond the matrix, use these criteria to stress-test your shortlist.
- Does it handle threshold alerts? An agency-grade tool should flag outliers automatically. You should be able to set a performance floor for a client category-like Retail vs. Tech-and get notified when a metric falls below that baseline. If you are still hunting for the dip, the tool is doing it wrong.
- Is it a workspace or a profile? You need to compare performance across a client set. If a tool requires you to switch workspaces to see a different client, it is not helping you benchmark; it is just adding clicks to your day.
- Is the refresh locked behind a manual wall? Some tools gate their refresh capability or force you to wait for a cooldown period. For high-volume teams, this is a non-starter. Look for platforms that prioritize system-driven maintenance so your dashboard is always current when you open it.
The goal is to move your team from "data gathering" to "strategic iteration." When you stop fighting your tools, you can finally focus on the actual performance of your client strategies.
How Mydrop supports this workflow
The real bottleneck for most agencies is not a lack of data, it is the lack of fresh and comparable data. In our experience, teams switch to Mydrop because the daily refresh eliminates that Sunday night "update the reports" anxiety. When you manage dozens of brands, you do not have time to wait for a manual export to finish before you can compare performance across your client portfolio.
Our analytics dashboard is designed around the reality that your team needs to act fast, not just observe. By caching workspace analytics for your connected social profiles, Mydrop allows you to load comparative views instantly. You can pivot between profile subcollections to see how your retail clients in one region are performing versus a different cohort, all without switching tools or re-authenticating across ten different platform logins.
The caching mechanism handles the heavy lifting, ensuring your dashboard loads data from a recent period, typically ending yesterday, so you are always analyzing current performance rather than data from two weeks ago. When a client asks for a performance check on a Tuesday, you do not need to pause your actual work to generate it. The data is already there, processed, and waiting for you to filter and export.
Operator rule: If your analytics tool requires more than three clicks to compare two different brand accounts, your tool is the bottleneck.
A simple shortlist checklist
Before you commit to a new platform or renew your current subscription, run these five questions by your team. If you answer "no" to any of these, you are likely paying for a reporter when you should be investing in an analyst.
| Evaluation Criterion | Why it matters | Must have? |
|---|---|---|
| Auto-refresh | Does the data update daily without manual intervention? | Yes |
| Normalization | Can you compare 'engagement' across TikTok, LinkedIn, and X? | Yes |
| Permissioning | Does the tool allow granular access for client stakeholders? | Yes |
| Thresholds | Can you set baseline goals for different account categories? | Yes |
| Caching | Do dashboards load instantly regardless of data volume? | Yes |
If the tool you are evaluating requires you to download a CSV to find the answer, it is not a benchmarking tool, it is a file storage solution.
Conclusion
Most teams do not have a content problem. They have a decision bottleneck. You are not failing because your content is not good enough, you are failing because the distance between your campaign's performance and your team's ability to iterate is too large.
Stop treating your analytics as a record-keeping exercise. The best analytics tools for agency benchmarking are those that turn data into a decision engine. If your current tool forces you to play catch-up with spreadsheet exports, you will always be fighting the last war instead of planning the next campaign. Find a platform that automates the collection and forces the comparison. Your team's sanity, and your clients' results, depend on it.