Agencies managing 10 or more brands do not need another dashboard that forces manual refreshes just to see if last week’s campaigns hit their targets. If your analytics tool requires you to click "refresh" and wait for a loading spinner every time you log in, you are working for the tool, not the other way around. At that scale, you need a centralized, cache-first infrastructure that delivers performance metrics the moment you open the page.
We know the drill. You are juggling a dozen browser tabs, three different platform logins, and a client who needs a report "yesterday." When you have to manually fetch data for twenty different profiles, the disconnect between raw numbers and client-ready strategy is where agencies bleed time, momentum, and billable hours.
What the best tools need to handle

At the agency level, analytics is infrastructure. It is not just about vanity metrics or pretty charts; it is about having a reliable data baseline that your team can trust without needing to verify if the connection is still alive or if the API timed out again.
To handle this volume, your stack needs to move away from "live-query" models-where the tool hits the social platform API every single time you view a dashboard-toward a pre-computed, cached workflow. This is the only way to ensure that your team, your managers, and your clients are looking at the same data without waiting for external platform latency.
Here is what separates a tool built for scale from a basic dashboard:
| Requirement | Why it matters for agencies |
|---|---|
| Multi-Profile Benchmarking | Comparing performance across brands is impossible if you have to export raw data to CSV first. |
| Automated Daily Refresh | If your data isn't fresh before your 9 a.m. standup, you are already behind. |
| Historical Data Stability | You need to trust that the data from last Tuesday is still there and hasn't drifted. |
| Platform-Native Normalization | A tool must normalize how "Engagement" is calculated so you can actually compare a LinkedIn post to a TikTok video. |
Operator rule: If a tool does not provide a cached performance snapshot, it is a data-viewer, not an analytics engine. For enterprise teams, a data-viewer is just another source of coordination debt.
Most teams get stuck because they rely on tools designed for individual creators. These tools are often excellent at showing you your specific reach, but they break the moment you try to manage thirty brands with varying API permissions, business account requirements, and access tokens. When you have hundreds of profiles under management, the "refresh" button becomes a bottleneck. You should be spending your time on strategy, not on re-authenticating expired tokens or waiting for a dashboard to ping a server for the tenth time that hour.
Where basic tools start to break

Basic analytics tools often fall apart the moment you move past a single brand account. If your workflow relies on live-API polling for every report-meaning the dashboard "thinks" while you wait for the data to fetch-you are essentially chaining your team to the loading screen.
This gets exponentially worse when you have ten or twenty clients. The "refresh" button becomes the most-clicked link in your browser, and every platform outage or API hiccup turns into a full-blown emergency. You aren't just losing time; you are losing the ability to have a cohesive, high-level view of performance because your tool treats every profile as an isolated event that needs its own dedicated, manual query.
Common mistake: Treating "live-only" data as a feature. For an agency, real-time data is often less valuable than historical, benchmarked context that loads instantly. If you have to wait for the data to compile during a client meeting, the window for strategic agility has already closed.
The buying criteria that matter
When selecting an analytics partner, stop looking at "number of metrics" and start looking at "operational stability." You need a tool that treats your data as infrastructure. The shift from a "viewer" to a "workspace" usually hinges on three specific requirements: unified benchmarking, cached stability, and automated refresh cycles.
Use this scorecard to audit your current stack. If your tool cannot check at least four of these boxes, your team is likely incurring massive "coordination debt" just to keep your client reports updated.
The Agency Analytics Scorecard
| Requirement | Why it matters for agencies | Success Criteria |
|---|---|---|
| Cached Data Layer | Eliminates wait times; ensures historical data is always available for quick insights. | Dashboard loads in < 2 seconds regardless of platform API health. |
| Cross-Platform Benchmarking | Allows you to compare success across distinct channels (e.g., YouTube vs. IG) using standardized metrics. | Unified dashboard view for at least 5 major social networks. |
| System-Led Refresh | Moves the burden of data collection away from the human operator. | Data refreshes automatically at least once every 24 hours. |
| Per-Profile Granularity | Prevents "all-or-nothing" report failures if one API connection is temporarily blocked. | Individual account errors are isolated; the rest of the workspace remains accessible. |
| Stakeholder Visibility | Ensures reports are client-ready without needing raw data manipulation in Excel. | Exportable summaries cover at least 30 days of performance. |
The most dangerous hidden cost in agency social media management isn't the software subscription price-it is the salary cost of staff members manually waiting for data to sync. If your current tool forces you to play "refresh tag" across a dozen client profiles, you are not really scaling your agency; you are just subsidizing a slow software architecture.
How Mydrop supports this workflow
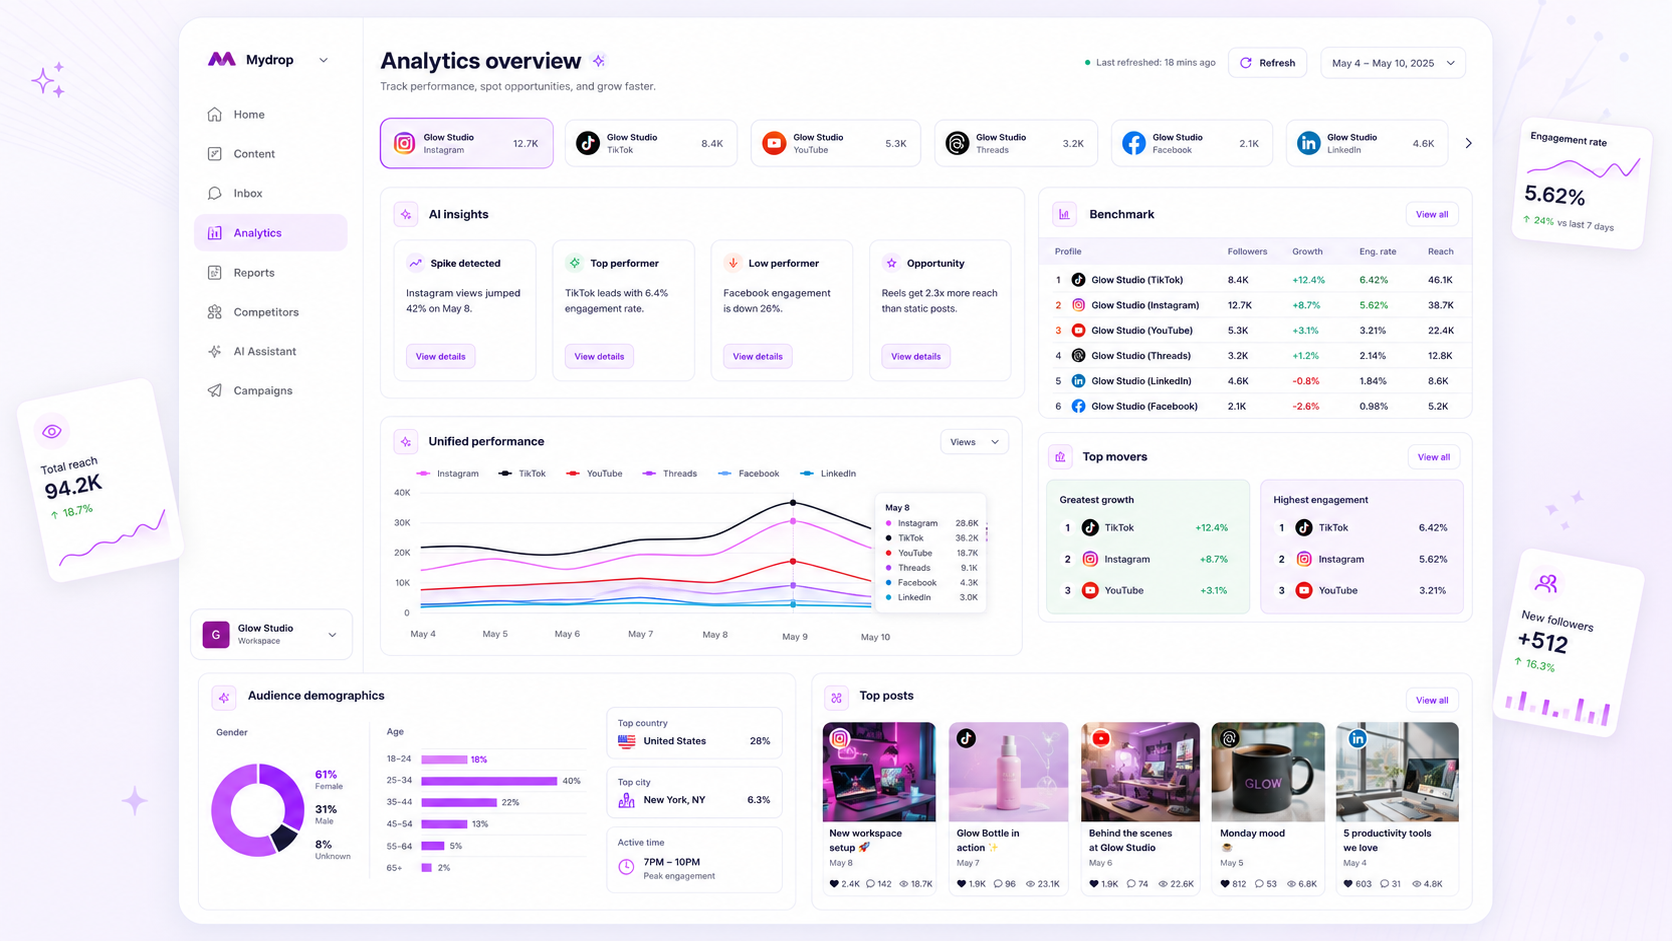
At Mydrop, we see the same pattern across hundreds of brand profiles: the actual bottleneck isn't getting the data, it's managing the coordination debt of keeping that data relevant. We built our Analytics Dashboard to solve for the "refresh-wait-refresh" cycle that turns a five-minute check-in into a twenty-minute deep-freeze.
The core philosophy here is cached readiness. Instead of firing off dozens of live API queries the second you log in, Mydrop keeps a persistent workspace dashboard in Analytics > Dashboard. It’s oriented around your performance over the last 30 days, ending yesterday. Because the data is already computed, your team gets instant visual access to benchmarks and trend summaries without the loading spinner of death.
For teams juggling dozens of accounts, we handle the platform-specific heavy lifting behind the scenes. Whether you are tracking YouTube watch time, X public metrics, or Google Business Profile calls, we surface those insights in a unified, normalized view. If a specific platform requires premium access-like certain tiers of the X API-our dashboard doesn't silently return zeros or break the layout. It intelligently surfaces the provider access error so you know exactly which integration needs a refresh or an elevated token.
Decision check: Don't confuse "current data" with "real-time data." For agency reporting, a stable, daily-refreshed cached dataset provides more value than a "real-time" view that breaks the moment an API rate limit is triggered.
A simple shortlist checklist
Before you commit to a platform for the next fiscal year, run your current setup-or any contender-through this scorecard. If it fails more than two of these, your agency is carrying hidden overhead.
| Requirement | Why it matters | Decision Rule |
|---|---|---|
| Cache-First Load | Removes API latency | Load time < 3 seconds |
| Unified Benchmarks | Normalizes metrics across platforms | Compare IG to LinkedIn |
| Auto-Refresh | Prevents manual chores | Daily background sync |
| Error Handling | Shows provider access status | Explicit API alerts |
| Multi-Profile View | Prevents "tab fatigue" | Workspace-wide scope |
The "Go/No-Go" Audit
- Does the dashboard load in under 3 seconds without a "fetching data" delay?
- Can you see a 30-day cross-platform summary for at least 10 profiles in one view?
- Does the tool handle API rate limits and token expirations gracefully?
- Is the data stored in a way that allows you to pull reports without re-polling live platforms?
- Are metrics missing vs. metrics zeroed clearly distinguished?
Conclusion
The most successful agencies we work with stop treating analytics as a forensic exercise performed once a month. They treat their dashboard as a living piece of performance infrastructure.
If you are currently spending your team's billable hours waiting for charts to populate or stitching together data from four different platform native tools, you aren't just losing time. You are losing the ability to pivot campaigns when it actually matters.
The goal isn't to look at more data. It is to spend less time managing the tools and more time deciding what to do with the insights they reveal. Pick a stack that respects your time by pre-computing the answers, then get back to the work that actually grows your clients' brands.