The difference between a scaling agency and one trapped in reporting hell is not the data you collect, but how fast you turn it into a branded, repeatable asset. If your team is still manually stitching charts together or tweaking brand colors for every single client, you are not just wasting hours; you are actively killing your margins. To scale, you have to stop treating reporting like a design project and start treating it as a product you ship.
We get it. The end of the month arrives, and suddenly you have five clients with five different needs hitting their deadlines at once. The coffee is cold, the data is messy, and the "branding" feels like a chore you have to perform over and over again. You shouldn't be hunting for a logo file at 6 p.m. on a Friday. The best teams move from "manual assembly" to "preset delivery" before they even hit the growth phase where the work becomes impossible.
What the best tools need to handle
When you are vetting software to fix this, do not get distracted by flashy UI that looks great on a screen but falls apart the second you hit export. The reality of agency work is that your output is often a PDF, and the friction between "digital dashboard" and "client-ready document" is where most tools break.
To keep your sanity, any software you choose must handle these three pillars of production:
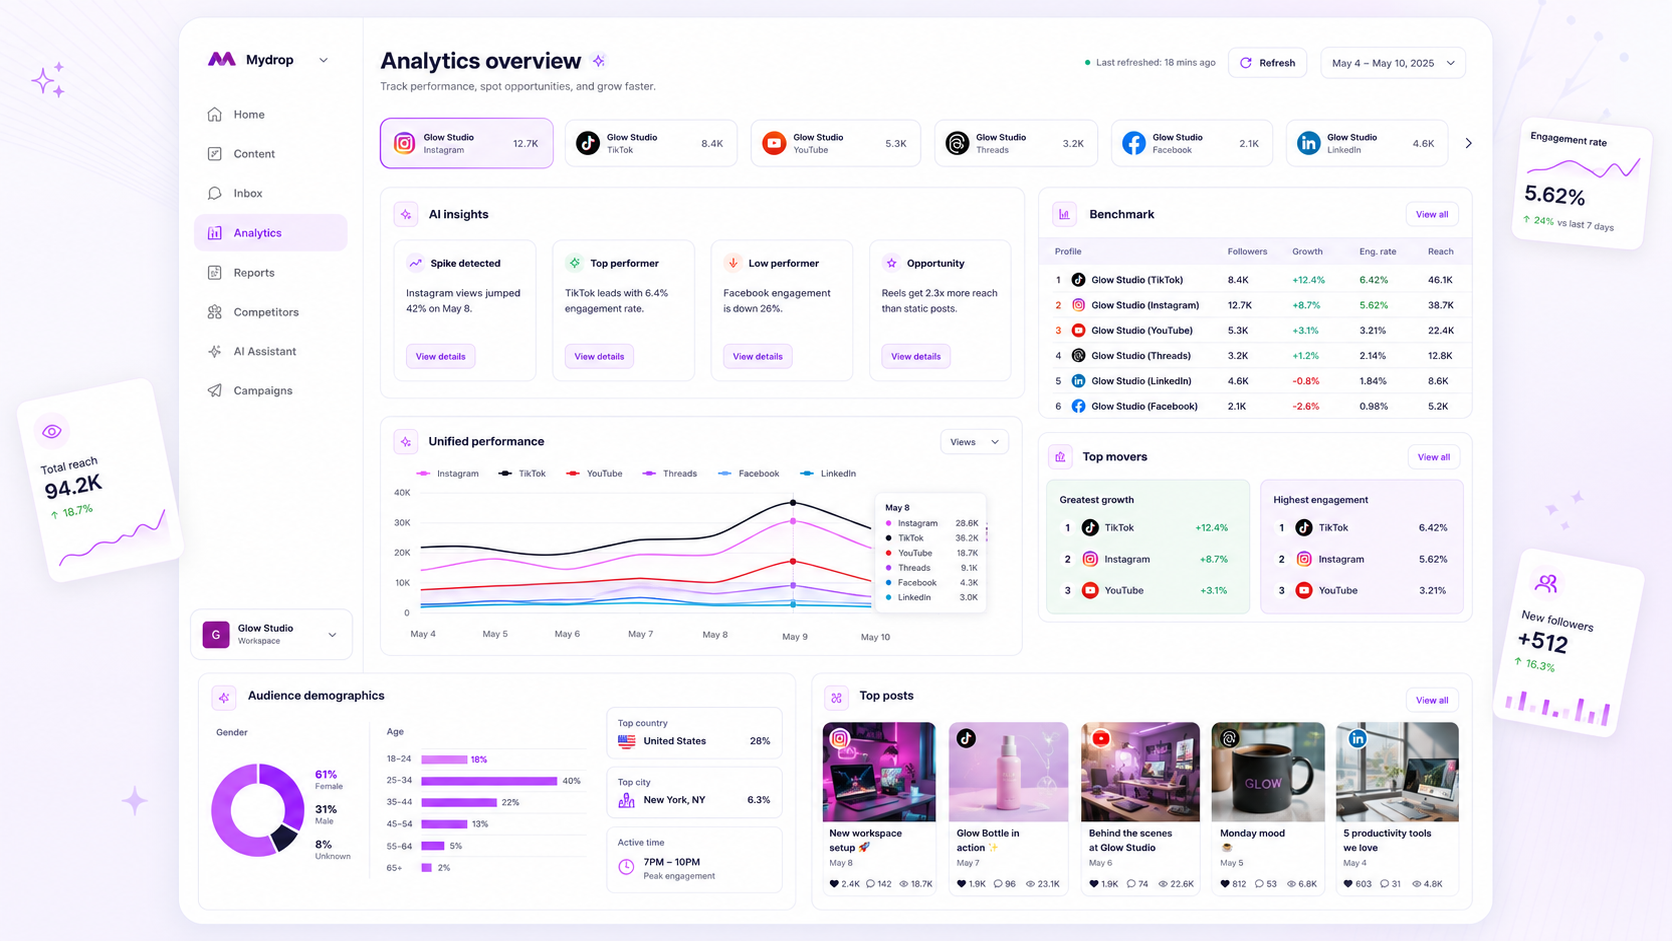
- Branding Snapshots: The software should store your client's identity-colors, logos, font choices, and contact details-as a persistent object. You should never have to manually re-apply a hex code. If you update the logo in the settings, the next report run should pick it up automatically.
- PDF Consistency: A report is only "client-ready" if the layout survives the journey from the browser to the PDF. Look for tools that generate clean, paginated exports without requiring you to manually resize charts or hide overflow elements. If the tool forces you to take screenshots of a dashboard to make a slide, it is a glorified browser extension, not a reporting platform.
- Narrative Integration: Raw numbers rarely sell your value. The best tools bridge the gap by allowing you to inject AI-driven summaries or manual post-list evidence directly into the report flow. You need to combine the quantitative data with the qualitative "why" of your strategy without copy-pasting from other apps.
Operator rule: If you are rebuilding the layout, metrics, or branding for a recurring report, the software has already failed you. Your tool should be a pipe, not a canvas.
Where basic tools start to break

Most teams hit a wall the moment they move beyond a single, straightforward dashboard view. You know the scenario: you have spent three hours fine-tuning a beautiful internal dashboard, but the client needs a PDF for their executive meeting in twenty minutes. You try to export, and the layout collapses. Fonts drift, charts get cut off, and the AI summaries-which looked brilliant on your high-res monitor-are now a mangled block of text.
The fundamental disconnect here is layout friction. Basic tools treat PDF generation as an afterthought, often just printing the browser’s current state. If your reporting software doesn't natively handle pagination, brand-specific aspect ratios, and custom cover pages, you aren't saving time; you are just shifting the labor from "building charts" to "fighting with PDFs."
Common mistake: Relying on tools that force you to manually screenshot widgets to fill in the gaps of a broken automated export. If you are regularly taking screenshots, you have already lost the battle for efficiency.
The buying criteria that matter
When you are scaling across dozens of profiles or brands, flashy UI is a trap. You need an architecture that supports repeatable production. If you cannot save a specific configuration-branding, metric selection, date logic, and AI prompt-as a single, re-runnable object, you will inevitably re-introduce human error every single month.
Use this scorecard to evaluate whether your current software is actually built for agency scale:
Agency Reporting Scalability Matrix
| Capability | Basic Dashboard Tool | Scaling Template Software |
|---|---|---|
| Preset Logic | Dashboard-level only | Persistent analyticsReportTemplates |
| Branding | Limited to logo swap | Dynamic branding snapshots per run |
| PDF Stability | Browser print fallback | Native rendering engine |
| Workflow Path | Manual rebuild per client | Configure -> Save -> Schedule/Run |
| Data Integrity | Real-time-only view | Durable analyticsReportRuns packages |
A reliable reporting platform must prioritize durable packaging. When you generate a report, the software should create a permanent record of what the data looked like at that specific moment, complete with the branding you applied. This isn't just about aesthetics; it is about compliance and maintaining a consistent "source of truth" for client stakeholders.
At Mydrop, we built our report builder because we watched agencies waste hundreds of hours each quarter just trying to make consistent deliverables. We found that the biggest friction point wasn't the data itself-it was the disconnect between raw insights and a client-ready package. When you support hundreds of brand profiles, the only way to stay sane is to treat reports as productized assets, not one-off tasks.
Decision check: If your reporting workflow requires more than three clicks to regenerate a previous month's report with current data, your tool lacks a template-first architecture.
Stop settling for tools that require you to remember the "right" settings for each client. Your reporting software should remember them for you, so your team can focus on the strategy that actually moves the needle, rather than formatting the cover page for the tenth time this week.
How Mydrop supports this workflow
At Mydrop, we built our Analytics Report Builder because we watched too many brilliant agencies waste their best hours on manual data stitching. We realized that for teams managing dozens of profiles, the friction wasn't in the analysis-it was in the assembly.
When you move from dashboard to delivery, you need more than just charts. You need a branded narrative that lands. Our approach is to treat "client-ready" as a saved state, not a Friday afternoon project.
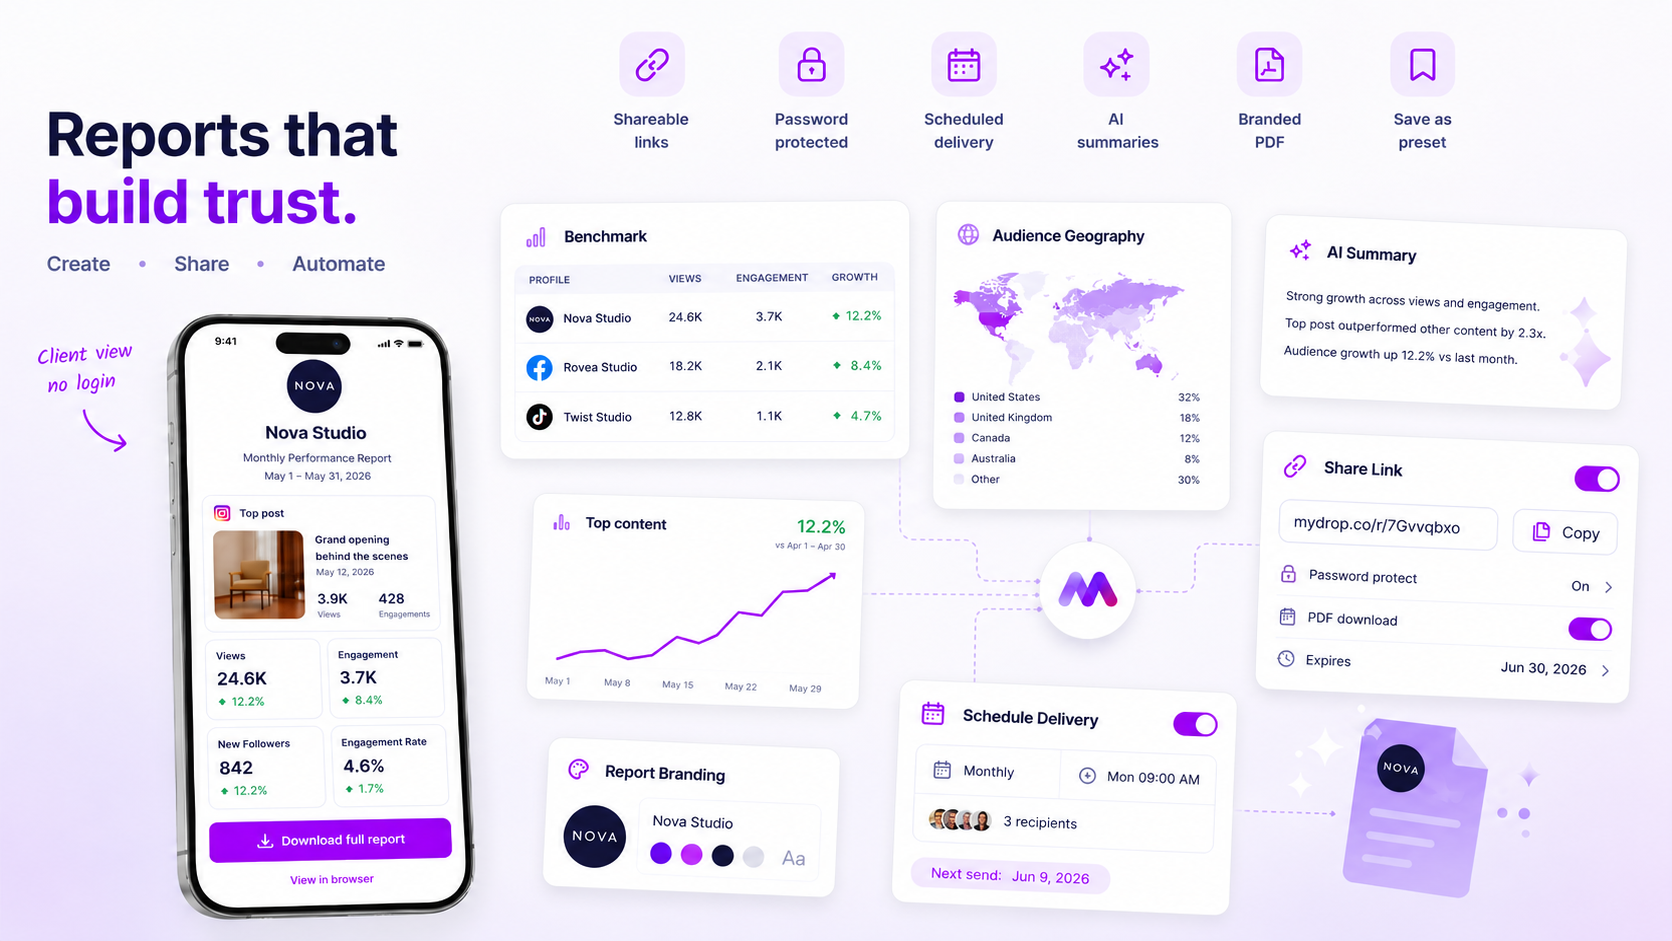
- Configure Once, Re-run Everywhere: You set up your brand assets, metrics, and report structure just once. Save it as a template preset, and the next time a client asks for last month’s performance, you aren't rebuilding the wheel-you are simply re-running the preset.
- Narrative Continuity: Our tool includes AI-driven summaries that pull context directly from your selected posts and metrics. It bridges the gap between raw data points and the "what actually happened" story your client wants to read.
- PDF Consistency: Stop worrying about layout shifts when exporting to PDF. We generate a durable, professional document that keeps your branding, fonts, and chart layouts exactly where you put them.
In our experience, the teams that scale are the ones that turn their reporting from a "task" into a "product." By standardizing your inputs and automating the packaging, you reclaim hours of billable time that used to vanish into formatting hell.
A simple shortlist checklist
If you are currently evaluating your reporting software, use this simple checklist to separate the tools that will help you scale from the ones that will keep you stuck in manual mode.
| Requirement | Why it matters |
|---|---|
| Reusable Templates | If you have to re-select metrics or adjust layouts for every recurring report, the tool is costing you money. |
| Branding Snapshot | Does the software allow you to store logos, custom colors, and cover pages so every report reflects your agency brand, not the tool's? |
| AI Narrative Integration | Can it draft a cohesive summary of the data and include evidence like top-performing posts? This is the fastest way to add value. |
| Direct PDF Export | Does it generate a high-quality, client-ready PDF directly from the dashboard view? If you are taking screenshots, you are losing quality and time. |
| Multi-Profile Grouping | Can you aggregate data across multiple channels or brand segments? Agencies rarely report on just one profile at a time. |
Conclusion
The difference between a stressed-out team and a high-performing agency often boils down to how they handle the final ten percent of the work: the reporting. You can have the most sophisticated data strategy in the world, but if your team is still manually copy-pasting charts at 6 p.m. on a deadline day, you are bleeding efficiency.
Stop treating analytics reports as static design projects. Treat them as repeatable products that run on their own schedule. Once you remove the manual friction of assembly, you give your team the space to stop being spreadsheet technicians and start being the strategic partners your clients are actually paying for. Invest in a workflow that works as hard as you do-your Fridays will thank you.