To scale agency reporting, you must stop treating your client updates as custom art projects and start treating them as a standardized product. The real bottleneck in most high-performing agencies isn't the data itself; it is the "branding-to-reusability" ratio that governs how much time your team burns on formatting rather than analysis. When you force your team to rebuild the same slides or charts from scratch every month, you are not providing a premium service. You are simply absorbing the cost of inefficient document editing.
We know the feeling. You are likely stuck in the "End-of-Month Rush," that frantic cycle of copy-pasting charts, manually adjusting hex codes to match client brand books, and double-checking labels while the clock ticks down. It is messy, it is prone to human error, and it is silently eating your agency’s profit margin. You need a workflow where your reporting is built to be repeatable from the start, effectively decoupling the effort of design from the speed of delivery.
What the best tools need to handle

The best reporting platforms do not just store numbers; they manage coordination debt. For an agency, this means moving beyond simple dashboards to systems that allow you to define, lock, and reuse complete reporting architectures.
If your current software requires you to reconfigure metrics, re-align logos, or re-verify data sources for each new client run, you are not using an enterprise tool. You are using a digital filing cabinet. Here is what you should demand from your stack:
| Capability | Why it matters | Agency Failure Mode |
|---|---|---|
| Reusable Presets | Saves hours of setup for recurring monthly or weekly performance reviews. | Every report starts as a blank, unbranded state. |
| Branding Snapshots | Ensures logo, color, and font consistency across distinct client identities. | Manual style tweaks result in inconsistent brand representation. |
| AI Narrative | Adds context to raw numbers, reducing the need for human drafting. | Reports remain cold, flat data dumps that clients ignore. |
| Stored Runs | Provides a durable history for audit, comparison, and quick retrieval. | Older data cannot be re-exported without recreating the original view. |
Operator rule: A report that requires more than three clicks to generate for a returning client is a candidate for full workflow automation.
The transition from a "custom deck" mindset to a "productized" approach is where your team stops being a group of manual data entry clerks and starts acting like a high-leverage consultancy. You need a platform that treats your report as a durable asset, not a temporary document you discard after the meeting ends.
When you look at your stack, ask yourself if your tool allows you to define your "Analytics-as-a-Product" standard. If the tool forces you to re-do the layout every time a stakeholder asks for an update, you have hit your ceiling for scale. True growth in a multi-brand agency comes from the ability to hit "generate" on a branded, AI-enhanced report and know with absolute certainty that it reflects your agency's professional standard, every single time.
Where basic tools start to break

Basic reporting tools-or worse, that "free" dashboard view you get in your native social apps-hit a hard ceiling the moment you try to manage more than three clients. You start to notice the friction when you have to rebuild the same report from scratch every single month because the tool cannot save your specific combination of metrics as a reusable object.
This is the point where maintenance debt kicks in. You spend your team’s most expensive hours acting as manual data entry clerks, moving screenshots from one tab to a slide deck just to align a logo.
Decision check: If you are still manually re-selecting your "favorite metrics" every time you open a report, you are not using a tool; you are using a spreadsheet with extra steps.
When a tool lacks a concept of a durable preset, your reports become snowflakes. Each one is unique, fragile, and impossible to scale across a growing roster. When a client asks for a slightly different view, or when a new team member joins and tries to "mimic" your past reporting style, the inconsistency ruins your professional presentation. That variability isn't just an annoyance; it is a direct hit to your agency’s profit margin.
The buying criteria that matter
Stop shopping for "dashboards" and start looking for a reporting studio. You need a system that treats a client report like a finished product-something you can define once, save as a template, and deploy on autopilot.
When evaluating your next tool, use this matrix to distinguish between basic visualizers and true enterprise-grade report builders.
Agency Reporting Decision Matrix
| Capability | Basic Dashboard Tools | Enterprise Report Builders |
|---|---|---|
| Logic | One-off view; rebuilds monthly | Stored runs and reusable presets |
| Branding | Fixed templates; limited logos | Branding snapshots per client |
| Context | Raw charts; no human narrative | Integrated AI-driven summaries |
| Delivery | Manual exports (CSV/PDF) | Scheduled, client-ready PDF packages |
| Evidence | Data only | Direct post-inclusion and search |
To find the right fit for your agency, look for these three non-negotiable markers of a serious tool:
- Presets as the unit of value: Can you save a custom selection of metrics, date ranges, and layout sections as a template? If the tool forces you to re-configure the layout every time you open the
Analyticstab, cross it off your list. At Mydrop, we designed the Analytics Report Builder specifically so you can build your ideal template once and apply it to any new brand or profile group instantly. - The Branding Snapshot: A report is a reflection of your agency’s quality. You need a system that locks in the logo, brand colors, and font preferences as a snapshot within the report run. This ensures that even if you update your agency branding later, your historical client reports remain consistent and professional.
- Narrative integration: Raw numbers are just noise to most stakeholders. A high-end tool must allow you to include AI-generated summaries that explain why the metrics moved, combined with actual post evidence. If you still have to write an email explaining the PDF, your report isn't doing its job.
The goal is to move your team from "data gathering" to "strategic advising." You stop chasing numbers and start delivering insights, which is exactly what your clients are actually paying for.
How Mydrop supports this workflow
At Mydrop, we see the same pattern across hundreds of brand profiles: the reporting cycle stops being a chore the moment you stop treating every document as a blank canvas. If your team is still manually grabbing screenshots or trying to re-format charts every Monday morning, you are effectively paying your best strategists to be data-entry clerks.
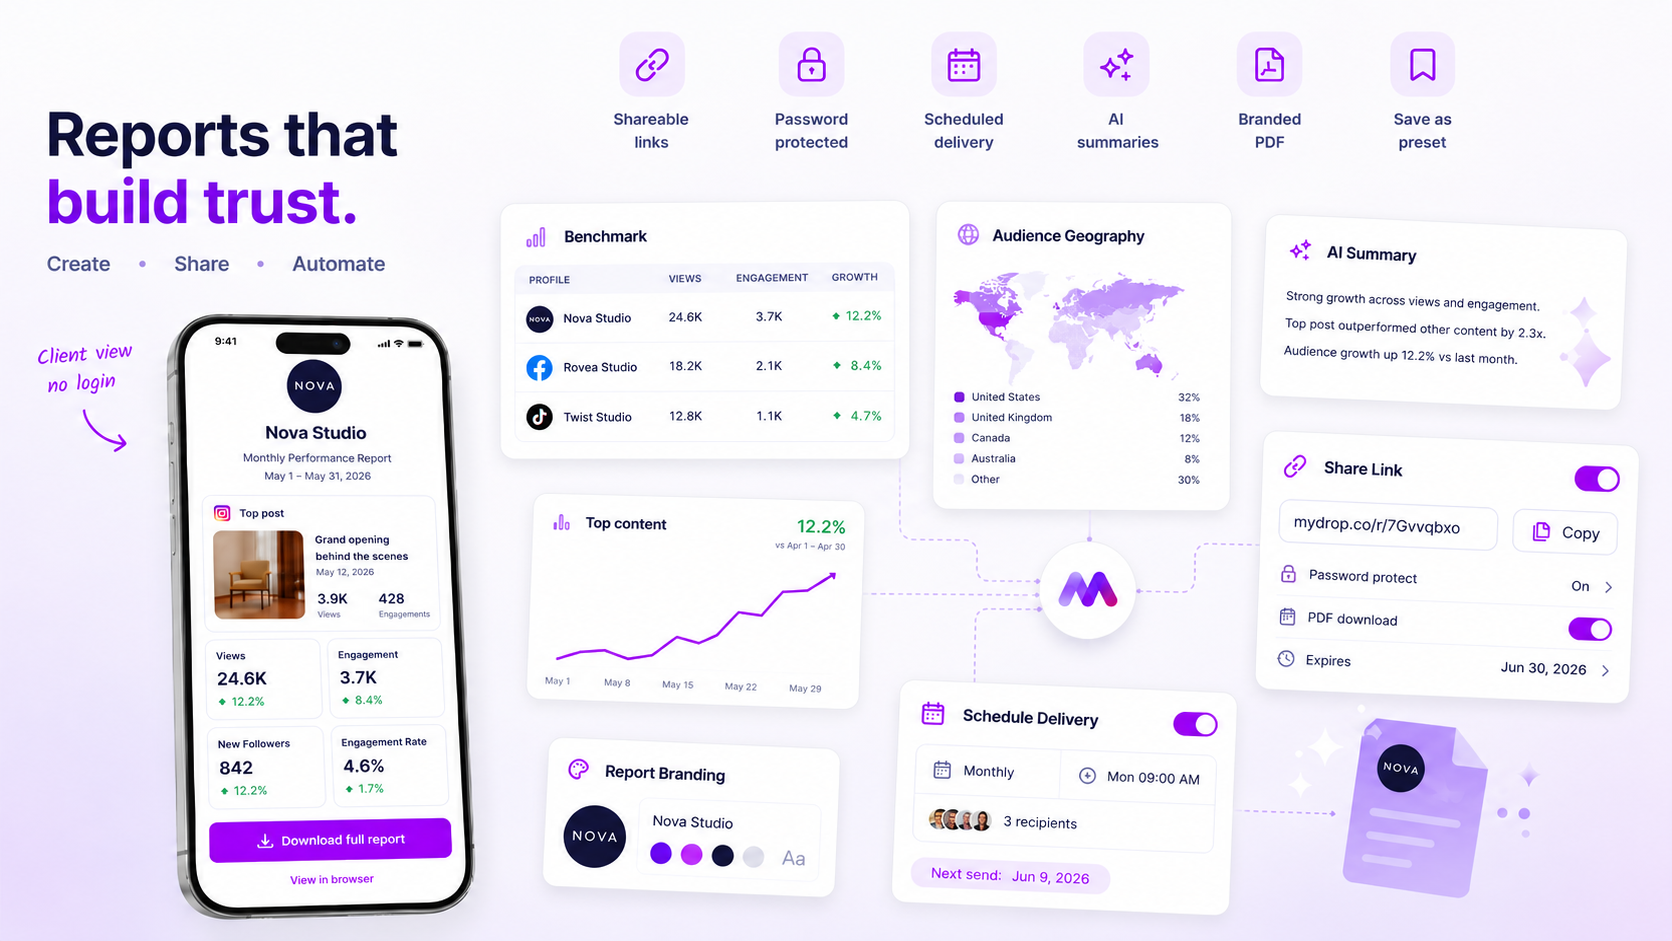
The Mydrop Analytics Report Builder is designed to reverse this. Instead of building a report, you build a reusable preset. You define your metrics, select the specific profiles or brand groups, and lock in your branding-logo, hex codes, and font-once. When the end-of-month rush hits, you simply apply that template to the new date range. The system pulls the latest data, runs the AI-driven narrative summary to highlight what actually moved the needle, and renders a client-ready PDF in minutes.
The real win here isn't just speed; it is governance. Because your brand identity is baked into the template, you never have to worry about a junior manager using the wrong logo version or an inconsistent footer. The output is a durable, branded deliverable that looks identical whether it comes from your New York team or your London office. You are not just sending a chart; you are shipping a standardized product.
A simple shortlist checklist
If you are currently evaluating your reporting stack, do not get distracted by flashy dashboard animations. Focus on these five operational requirements to ensure your tool can actually scale with your agency.
| Requirement | Why it matters |
|---|---|
| Preset Reusability | Can you save a configuration as a template and apply it to a new client in under 60 seconds? |
| Branding Snapshots | Does the tool lock in your client’s visual identity so the report doesn't break when brand guidelines evolve? |
| AI Synthesis | Does it provide a written narrative summary, or are you still manually typing out the "why" behind the numbers? |
| Durable PDF Output | Can you generate and store a timestamped PDF so you have an audit trail of exactly what was presented? |
| Multi-Profile Groups | Can you report on a single brand across ten channels, or a portfolio of five different clients simultaneously? |
If you are checking these boxes, you are moving away from "service-as-an-art-project" and toward a scalable agency model.
Conclusion
The difference between an agency that suffocates under its own success and one that thrives isn't the quality of its designers-it is the maturity of its operations. You will always have more data than you have time to process. The only way to win is to stop manual labor from being a prerequisite for quality.
Choose a tool that treats your reports as a replicated product rather than a recurring design task. When your reporting stack handles the branding and synthesis automatically, your team is free to focus on what you were actually hired for: deciding what to do next.