When your analytics dashboard stops updating, you aren't just looking at missing numbers; you are looking at a blind spot in your current campaign strategy. Most "data failures" are not actually system glitches but minor breakdowns in token permissions or platform-specific connection health. Before you report a total system failure, stop and check the last refresh timestamp. If it exceeds 24 hours, treat the data as non-actionable until a manual re-sync confirms the connection status. Every hour of stale data is an hour where your team is making creative decisions based on intuition rather than current reach and engagement signals.
We get it. Your team has a high-stakes campaign running, and the dashboard is showing a flatline or stale date. That sinking feeling when you realize you are steering the ship without current metrics is familiar to every operator in the industry. It turns the dashboard from a tool for clarity into a source of anxiety. But the solution is almost always a routine bit of maintenance rather than a deep infrastructure crash.
The decision each metric should trigger

Data is useless if it does not force a choice. If you are checking an analytics dashboard without knowing which action follows the data, you are just doom-scrolling through your own performance. For enterprise teams, every metric should map directly to a decision gate.
| Metric | Decision Trigger | Stale-Data Risk |
|---|---|---|
| Reach/Impressions | Pivot creative assets or boost budget | Massive: Overspending on failing ads |
| Engagement Rate | Adjust community response tactics | Moderate: Delayed response to audience sentiment |
| Video Watch Time | Retool hook strategy/video pacing | High: Missing retention issues for new formats |
| Profile Views | Update bio or CTA alignment | Low: Tactical adjustment rather than strategic |
Operator rule: If your data is more than 24 hours old, do not touch the budget. You are fighting ghost enemies with stale intelligence. At Mydrop, we built the Analytics Dashboard to auto-refresh daily because we know that "waiting for it to update" is just a form of hidden coordination debt. If you see that "stale" flag, reset the handshake. It takes two minutes and saves you from the danger of acting on information that expired yesterday.
The scorecard that keeps reporting useful

The secret to a healthy analytics workflow is not tracking everything; it is tracking the few signals that actually trigger a reaction. When you stop treating every vanity metric as a priority, you stop the data paralysis that hits when numbers inevitably lag or go missing.
We see teams struggle when they try to mirror the platform-specific dashboards of ten different networks into one impossible-to-read spreadsheet. Instead, define a core Performance Baseline for every profile you manage. This turns your reporting from a stressful fire drill into a routine pulse check.
Illustrative Performance Scorecard
Use this matrix to categorize your metrics. If a metric does not fall into "Actionable" or "Strategic," stop reporting it by default.
| Category | Primary Metric | Purpose | Action Trigger |
|---|---|---|---|
| Growth | Follower Delta | Audience health | If negative 3 months, audit content mix |
| Engagement | Engagement Rate | Content resonance | If below 1.5%, rotate creative formats |
| Efficiency | Reach per Impression | Ad/organic spend value | If variance > 20%, re-examine targeting |
| Conversion | Link Clicks/Actions | Business impact | If zero for 7 days, check tracking links |
Decision check: If a metric does not have a defined action trigger, remove it from your executive dashboard. Data without a corresponding decision is just noise that makes it harder to spot real system failures.
What to stop measuring by default
Most teams bury themselves in vanity data because they are afraid of missing a signal. In reality, you are just hiding the performance of your actual business goals. Stop measuring "Likes" as a primary KPI-they are high-volume, low-intent signals that rarely correlate with business value.
Also, stop trying to manually track "Video Views" across platforms as a single aggregate number. Because TikTok, YouTube, and LinkedIn define "a view" differently, your total number is fundamentally flawed. You are comparing apples, oranges, and a single grape.
Instead, shift your focus to Retention and Conversion. If you are using the Mydrop Analytics Dashboard, lean into the pre-calculated benchmarks. They are designed to normalize these platform-specific differences, allowing you to see which content formats are winning across your entire workspace, rather than getting stuck in the weeds of platform-specific definitions.
When you simplify your dashboard to focus on Actionable Signals, you also make it immediately obvious when data is actually missing. If you only look at four key metrics, a "0" or a "missing" status is a loud alarm. If you look at forty, a missing data point is just another cell in a sea of gray, likely to be ignored until it is too late.
How to connect metrics to next actions
The bridge between raw data and your next campaign pivot is a clearly defined decision trigger. If you aren't ready to act on a metric, don't waste the team's bandwidth measuring it. In our experience working with multi-brand teams, the most effective way to avoid "dashboard paralysis" is to map every major KPI to a specific response.
When you see a dip, your team shouldn't be asking "What does this mean?"-they should be asking "Which protocol do we run?"
| Metric Signal | Potential Meaning | Required Response |
|---|---|---|
| Engagement Rate < 1% | Content mismatch or format fatigue | Audit creative assets; test a new hook |
| Reach Plateau | Algorithm shift or target drift | Revise audience segments; boost evergreen content |
| GBP Calls / Clicks Down | NAP data error or location closed | Verify local listings; update business hours |
| Watch Time < 30% | Slow opening or boring mid-roll | Cut the first 3 seconds; shorten content loop |
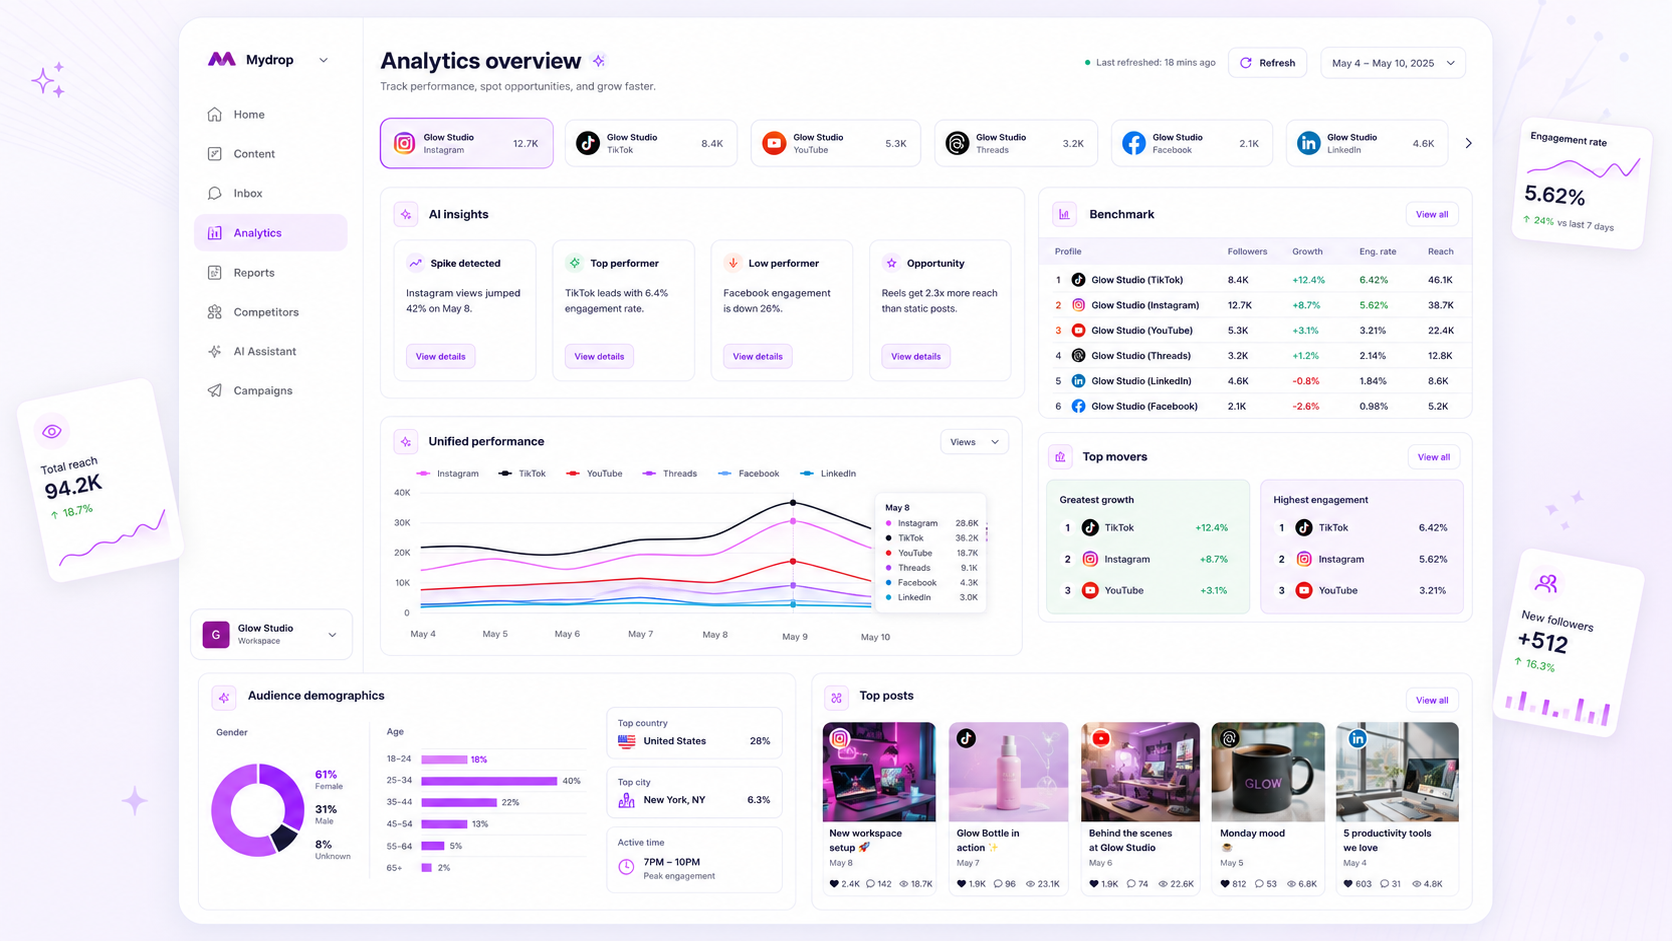
At Mydrop, we designed our Analytics Dashboard so that teams can quickly compare profiles side-by-side. Use this view not just to report numbers, but to spot relative performance. If one brand profile in your portfolio is outperforming another with the same budget, you have an immediate internal benchmark for a process improvement.
The review cadence that makes the model stick
Data only creates value when it informs a repeatable habit. If your team treats analytics as a "whenever we remember" task, you lose the ability to spot trends before they become disasters.
The most successful enterprise operators we know use a tiered review system to keep the signal clear:
- Monday Morning (The Pulse Check): Review the previous week's performance. Focus exclusively on whether core growth metrics met the team's minimum viable reach. If a profile shows a "stale" flag, trigger an immediate manual refresh before the meeting starts.
- Mid-Month (The Strategy Pivot): Analyze performance by content pillar. This is when you decide to kill underperforming formats or double down on high-converting assets.
- Quarterly (The Benchmarking Sync): Compare portfolio-wide performance against your annual goals. This is your chance to address coordination debt and ensure your team's output remains aligned with your broader brand governance.
Workflow check: If a metric doesn't lead to a documented "stop, start, or continue" decision at one of these three intervals, remove it from your dashboard view entirely.
Conclusion
The messy reality of enterprise social media is that connection drift is inevitable. Tokens expire, API scopes change, and platforms update their rules. The goal isn't to build a "glitch-proof" system, but to build a team that knows exactly how to troubleshoot and recover when the numbers go dark.
Your data is only as good as the handshake behind it. When the dashboard goes quiet, don't let it become a mystery; treat it like a maintenance task. Clear the cache, reset the handshake, and get back to the work that actually moves your brand forward. Remember: the real bottleneck isn't the data itself, but the speed at which your team can interpret, pivot, and execute.