Effective response time targets aren't about being "as fast as possible" across every channel; they are about tiered Service Level Agreements (SLAs) that treat a high-urgency WhatsApp inquiry differently than a casual LinkedIn comment. Most enterprise teams fail at social support because they chase "Average Response Time," a vanity metric that conveniently hides the high-stakes customer DM currently rotting at the bottom of a 48-hour-old notification pile. To fix this, you need a measurement-first model that categorizes inbound volume by platform intent and urgency, ensuring your team isn't treating a "thanks!" emoji with the same priority as a billing crisis.
We have all been there: scanning five different native apps, feeling like you are failing your customers in slow motion because you can't see the signal through the noise. It is messy, it is loud, and it creates a "coordination debt" that eats your team's afternoon. The goal isn't just to be fast; it is to be consistently reliable.
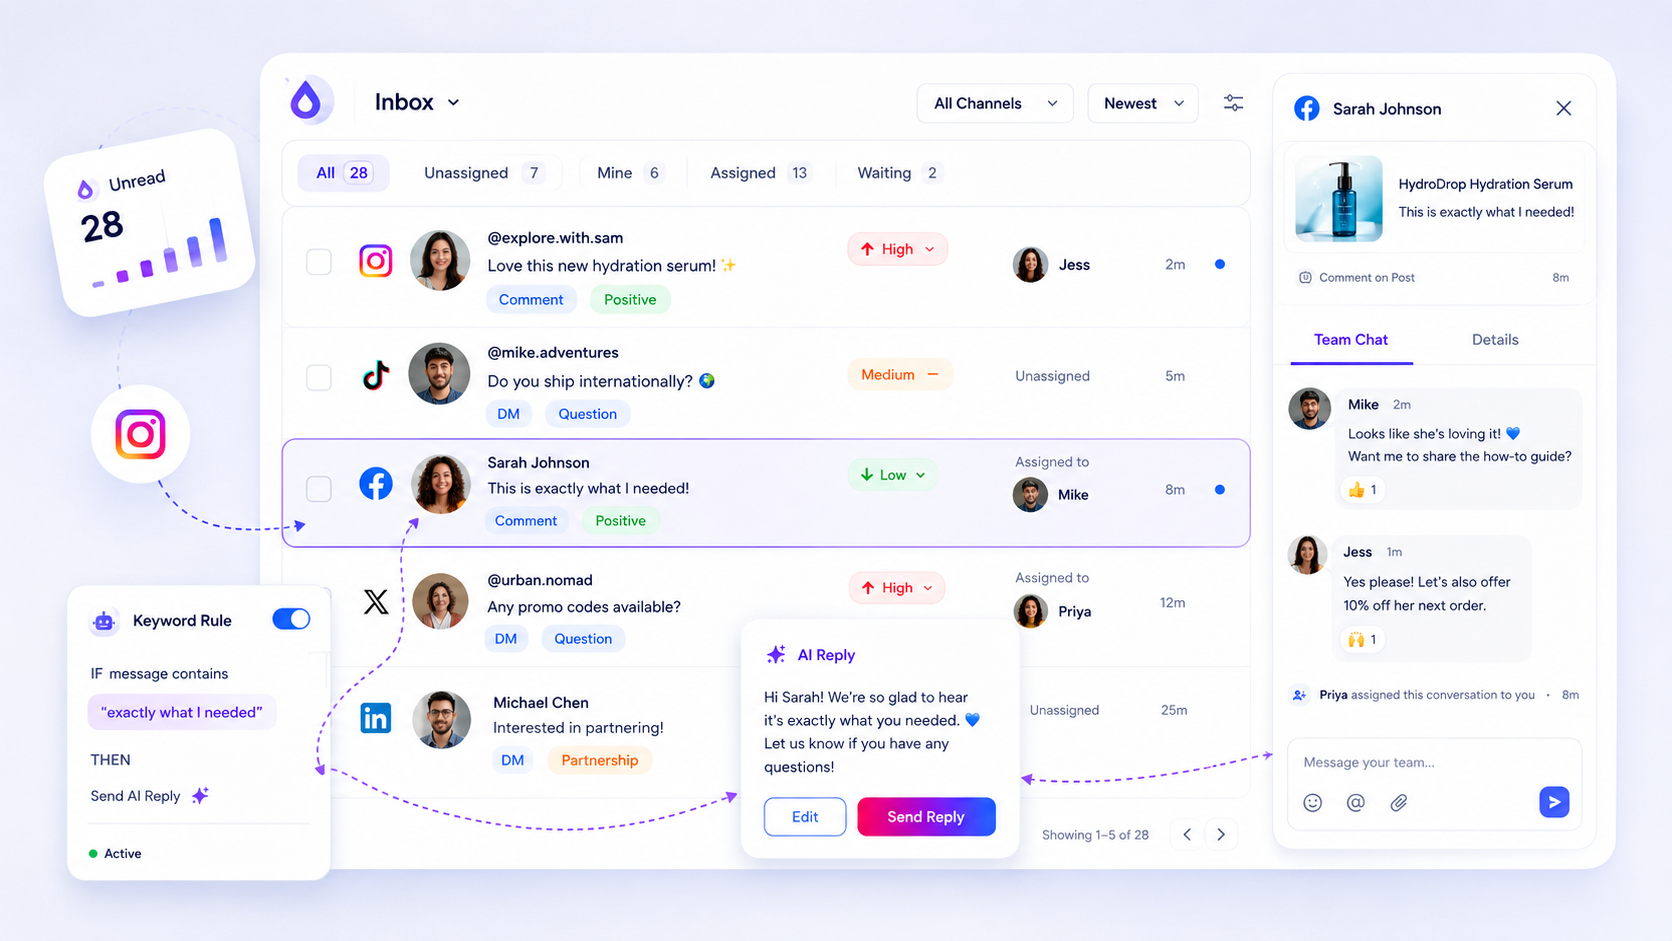
At Mydrop, we see that the most successful operations don't just "try harder." They use a normalized inbox to turn chaotic pings into a structured queue. Here is how to benchmark your performance across different channels using a tiered SLA model.
Operator rule: Speed is not a result of "trying harder"; it is a byproduct of a normalized inbox.
Illustrative Social Support SLA Scorecard
| Platform | Inquiry Type | Target (Good) | Warning (At Risk) | Action at Warning |
|---|---|---|---|---|
| Direct Support | < 15 mins | 30 mins | Reassign to Lead | |
| Direct Message | < 2 hours | 4 hours | Generate AI Draft | |
| Post Comment | < 6 hours | 12 hours | Tag Brand Manager | |
| Public Wall | < 4 hours | 8 hours | Shift to Priority 1 |
The decision each metric should trigger

A metric without a corresponding action is just a decoration. If your dashboard says you are missing your WhatsApp targets, the response shouldn't be a Slack message telling the team to "pick up the pace." That is how burnout starts. Instead, your targets should trigger specific workflow shifts that lower the friction for the person actually doing the work.
When a thread enters the "danger zone," the protocol needs to change. In our experience, the most effective trigger is a shift in ownership or tooling. For example, if an Instagram DM hits the two-hour mark without a response, your operating habit should be to immediately generate an AI draft. This gives the human agent a 90% completed response to polish instead of a blank screen to stare at while they are already feeling behind.
This is where having a unified operational queue pays off. Because Mydrop normalizes threads from Instagram, WhatsApp, and LinkedIn into one view, you can set rules that change a thread's status or priority the moment it breaches an SLA. You aren't just watching the clock; you are actively moving the hurdles out of your team's way. The "Hidden Cost of Averages" is that they hide the pain. Real-time triggers expose the pain and then solve it.
Think of these targets as operational tripwires. If a thread stays unread for too long, it shouldn't just sit there. It needs to be reassigned or tagged with a higher priority automatically. The goal is to move the conversation from "needs reply" to "resolved" before the customer starts reaching for the public "at-mention" button to air their grievances.
The scorecard that keeps reporting useful

The fastest way to burn out a social team is to tell them everything is a priority. If a "thanks for sharing" comment on LinkedIn has the same internal weight as a "my order is missing" DM on WhatsApp, your team will naturally gravitate toward the easy wins while the high-stakes fires keep smoldering.
We have seen this play out across dozens of enterprise teams: they set a flat two-hour response target for everything, and then wonder why their customer satisfaction scores are tanking. The reality is that your audience has different expectations for different channels. You wouldn't expect a formal letter and a text message to have the same turnaround time, so why treat your social inbox like a monolith?
The goal of a scorecard is to create operational tripwires. These are not just numbers to put in a slide deck at the end of the month; they are instructions that tell your team exactly when a thread has entered the "danger zone" and needs a different approach.
Here is a sample SLA Scorecard we use to help teams move from "guessing" to "operating."
| Platform | Thread Type | Target SLA | Action if Missed |
|---|---|---|---|
| Support / Crisis | 1 Hour | Reassign to Lead + Internal Note | |
| DM / Sales Lead | 4 Hours | Generate AI Draft for Review | |
| Wall Comment | 12 Hours | Apply "Needs Review" Tag | |
| Event / News Comment | 24 Hours | Mark as Resolved / No Reply | |
| All Channels | Negative Sentiment | 2 Hours | Escalation to PR / Legal Sync |
At Mydrop, we see the most successful teams use these targets to automate the triage process. When every platform's notification looks different, it is impossible to stay consistent. By normalizing those threads into one queue, you can finally see that the WhatsApp ping from 59 minutes ago is objectively more important than the thirty LinkedIn emojis that just landed.
What to stop measuring by default
If you want to fix your response times, you have to stop looking at Average Response Time. It is the participation trophy of social metrics.
Averages are dangerous because they hide the outliers. You might have a "great" average response time of 30 minutes, but that usually means you are replying to easy comments in 2 minutes while your most frustrated customers are sitting in a 48-hour void. Your average looks fine, but your brand health is actually failing.
Here is the awkward truth: your angry customers don't care about your average. They care about their wait.
Decision check: Stop reporting on "Total Volume" as a success metric. High volume is just noise unless you are measuring the percentage of high-value threads that stayed within your SLA.
Instead of the standard dashboard clutter, we recommend focusing on these three specific signals:
- % Within SLA: This is the only number that matters for enterprise health. If 95% of your WhatsApp support queries are answered within an hour, you are winning. If that number drops to 80%, you don't need to "work harder" -- you need to reallocate staff or use AI drafts to clear the backlog.
- Resolution Rate by Assignee: This helps you spot where threads are getting stuck. Is one specific market or brand group struggling to close out conversations? That is usually a sign of a coordination bottleneck, not a slow agent.
- The "Ghost" Rate: The number of threads that hit 24 hours without a single internal action (a tag, a note, or a reply). This is your brand damage metric.
By shifting your focus from "how much did we do" to "how well did we meet the promise," you turn reporting from a chore into a diagnostic tool. You stop guessing if the team is overwhelmed and start seeing exactly where the coordination debt is piling up.
How to connect metrics to next actions
A metric without a corresponding action is just a decoration. If your dashboard shows you are 20% behind your WhatsApp response target, that is just bad news-it is not a strategy. To actually move the needle, you need to map every At Risk threshold to a concrete team move.
In our experience, the most effective teams use their inbox status as a living triage system. When a thread enters the danger zone, the response should not be a generic "everyone check the DMs" Slack message. It should be a specific operational handoff.
For example, when a high-priority thread hits its two-hour mark without a reply, you might trigger one of these three actions:
- Automated Handoff: Reassign the thread from a general queue to a senior lead or a dedicated "escalation" specialist.
- AI Assistance: Use Mydrop to generate an AI draft. This gives the human agent a 70% head start on the reply by pulling in brand context and thread history immediately.
- Status Escalation: Change the thread status to Priority: High to pull it to the very top of the unified queue, ensuring it is the next thing anyone on the team touches.
This is where having a normalized inbox saves your sanity. Because Mydrop pulls DMs and comments from Instagram, LinkedIn, and WhatsApp into a single, consistent view, your team doesn't have to remember different rules or "vibe checks" for different apps. The tripwire logic stays the same across the board, reducing the cognitive load on your agents.
The review cadence that makes the model stick
Reviewing your social support metrics once a quarter is like checking your GPS after you have already missed the exit. To keep your operations from drifting into chaos, you need a two-tier review cadence that balances "right now" fixes with "next month" strategy.
The Weekly Pulse Check This isn't for deep data diving. It is for identifying "Ghost Threads"-those weird outliers where a customer waited 36 hours because a notification got buried or a thread was accidentally marked as read. You aren't looking for averages here; you are looking for the failures. If one platform is consistently hitting the At Risk mark, you likely have a staffing gap or a coordination bottleneck between marketing and support.
The Monthly SLA Audit This is when you decide if your targets are actually realistic. If your team is hitting 99% of their targets but everyone is burnt out and the replies feel robotic, your SLA might be too aggressive. Alternatively, if you are hitting your numbers but customer sentiment is still dropping, you are likely measuring speed at the expense of resolution quality.
Workflow check: If you hit your SLA 100% of the time, your target is too easy. If you hit it 60% of the time, your team has stopped looking at the dashboard because it is demoralizing. Aim for a 90% success rate as your "healthy" baseline.
| Review Type | Frequency | Primary Question | Actionable Output |
|---|---|---|---|
| Pulse Check | Weekly | Where did we fail the SLA tripwire? | Immediate reassignment or triage adjustment. |
| Health Audit | Monthly | Are these targets helping the business? | Update SLA thresholds or refine AI draft prompts. |
| Strategic Sync | Quarterly | Is social support reducing tickets elsewhere? | Budget or headcount justification for the next cycle. |
Your "Action This Week" Checklist
If you are currently flying blind, do not try to fix every channel at once. Start here:
- Audit the outliers: Export your last 100 inbox threads to CSV and find the five longest wait times. Why did they happen?
- Pick one tripwire: Define a "Danger Zone" for your most important channel (e.g., 2 hours for WhatsApp DMs).
- Define the owner: Explicitly name who handles a thread the moment it hits that tripwire.
Conclusion
Speed is a byproduct of a system, not a result of "hustling" harder. When you stop chasing the vanity metric of "Total Volume" and start obsessing over your % within SLA, the entire energy of the social team shifts. You move from being reactive and overwhelmed to being a controlled, professional operation that treats social engagement as the high-stakes customer service channel it actually is.
Social support is often the first place a customer interacts with your brand when something goes wrong. By setting clear targets and connecting them to real-time actions, you aren't just hitting numbers-you are building trust at a scale that manual scrolling can never reach.