Stop trying to solve local creative fatigue with global platform data. Use multi-profile benchmarks to isolate platform-wide systemic issues, then pivot to individual profile subcollections only when you have clear evidence of a localized performance bottleneck.
We get it-when you are managing ten brands across thirty accounts, the Analytics tab feels less like a strategic tool and more like a firehose of noise. You are drowning in data but starving for the specific insight that actually justifies your next pivot. That gap between "the numbers are down" and "here is what we need to change" is where most teams burn their most valuable hours.
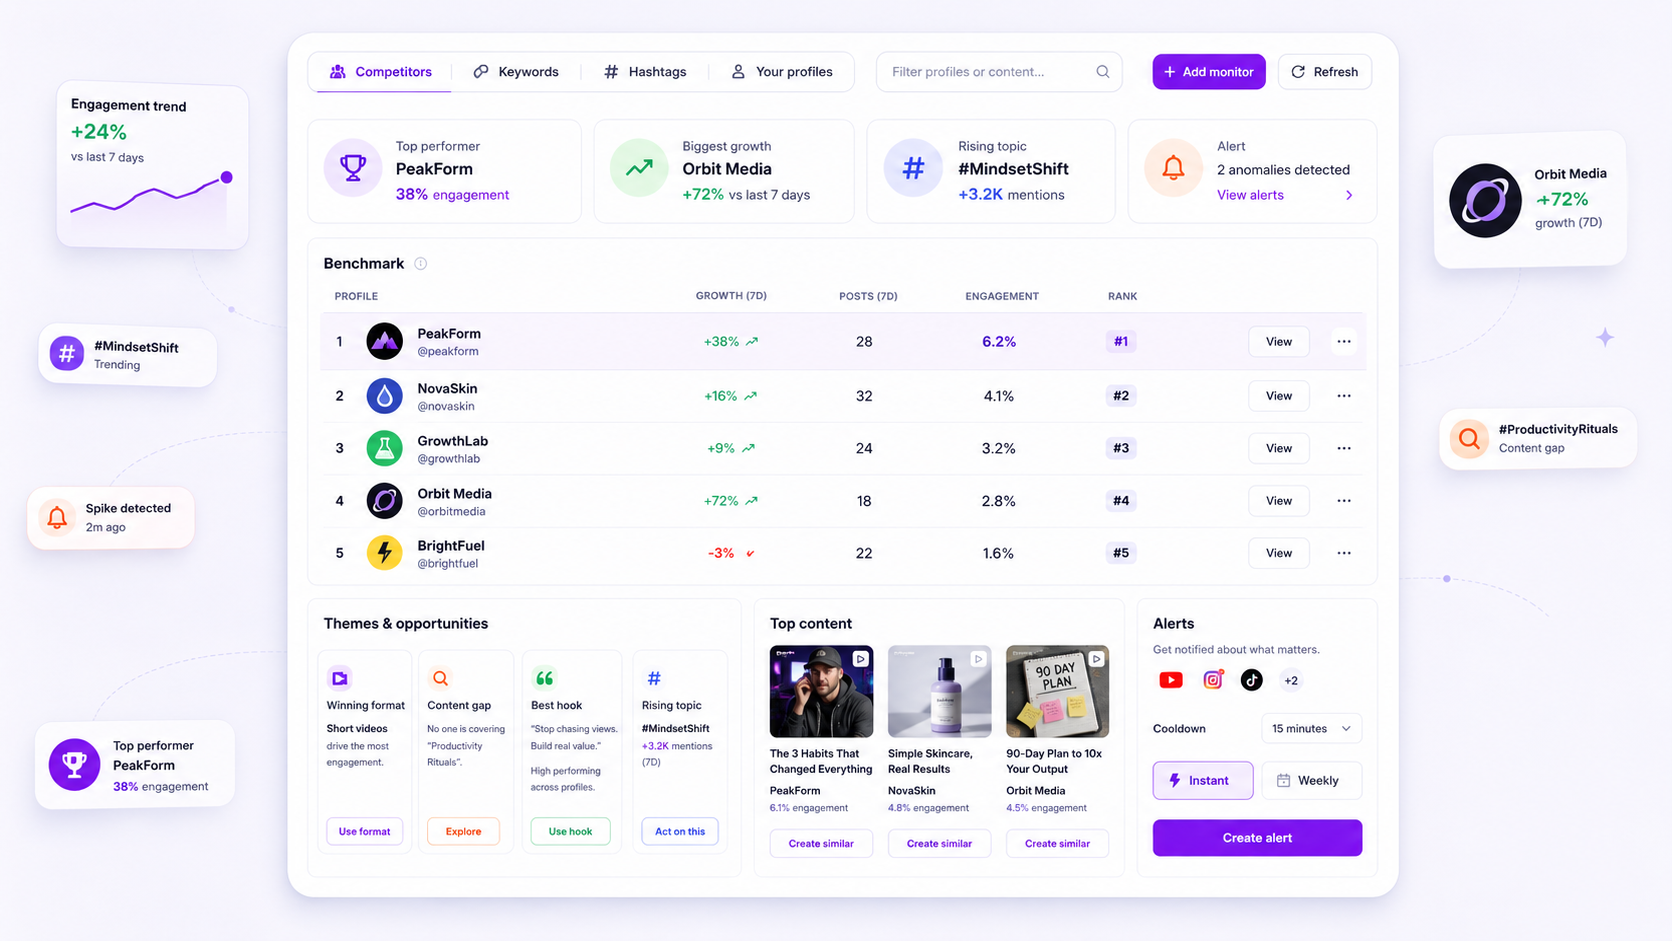
The real cost of enterprise reporting is the Context Switch Tax. Teams often spend hours running deep-dive audits on accounts that are actually performing fine, simply because they lacked the broad benchmark data to prove that the problem was just a bad week on the platform.
Operator rule: If your reach is down by 15% across every single account, stop auditing the creative. You are looking at a platform-wide shift. If your reach is down by 15% on one account while the others are flat or up, the problem is sitting on your desk.
The decision teams usually frame too broadly
Most teams treat "Analytics" as a destination. They treat it like a report that must be generated, checked, and filed, rather than a diagnostic process. Because of this, they default to one of two extremes: they either stay zoomed out on global dashboard charts forever, ignoring individual failures, or they go into deep-dive mode for every profile, every week, regardless of performance.
Neither habit scales.
When you treat benchmarking and auditing as one task, you lose the ability to act fast. You end up with a workflow that looks like a crime scene-spreadsheets everywhere, twenty tabs open, and a team that is exhausted from chasing metrics that aren't actually moving the needle.
A simple diagnostic shift changes the game. By establishing a clear threshold for when to pivot from a high-level view to a surgical drill-down, you eliminate the guesswork. You stop treating every "down arrow" as a crisis and start treating them as signals. The goal isn't to look at more data; it’s to look at the right data until you have the answer.
What should stay manual and what can move faster

The biggest time-sink in modern social operations is treating every data point as a "find the answer" mission. If you are manually refreshing dashboards every time a stakeholder asks "how is the campaign going," you are not managing a brand-you are babysitting a spreadsheet.
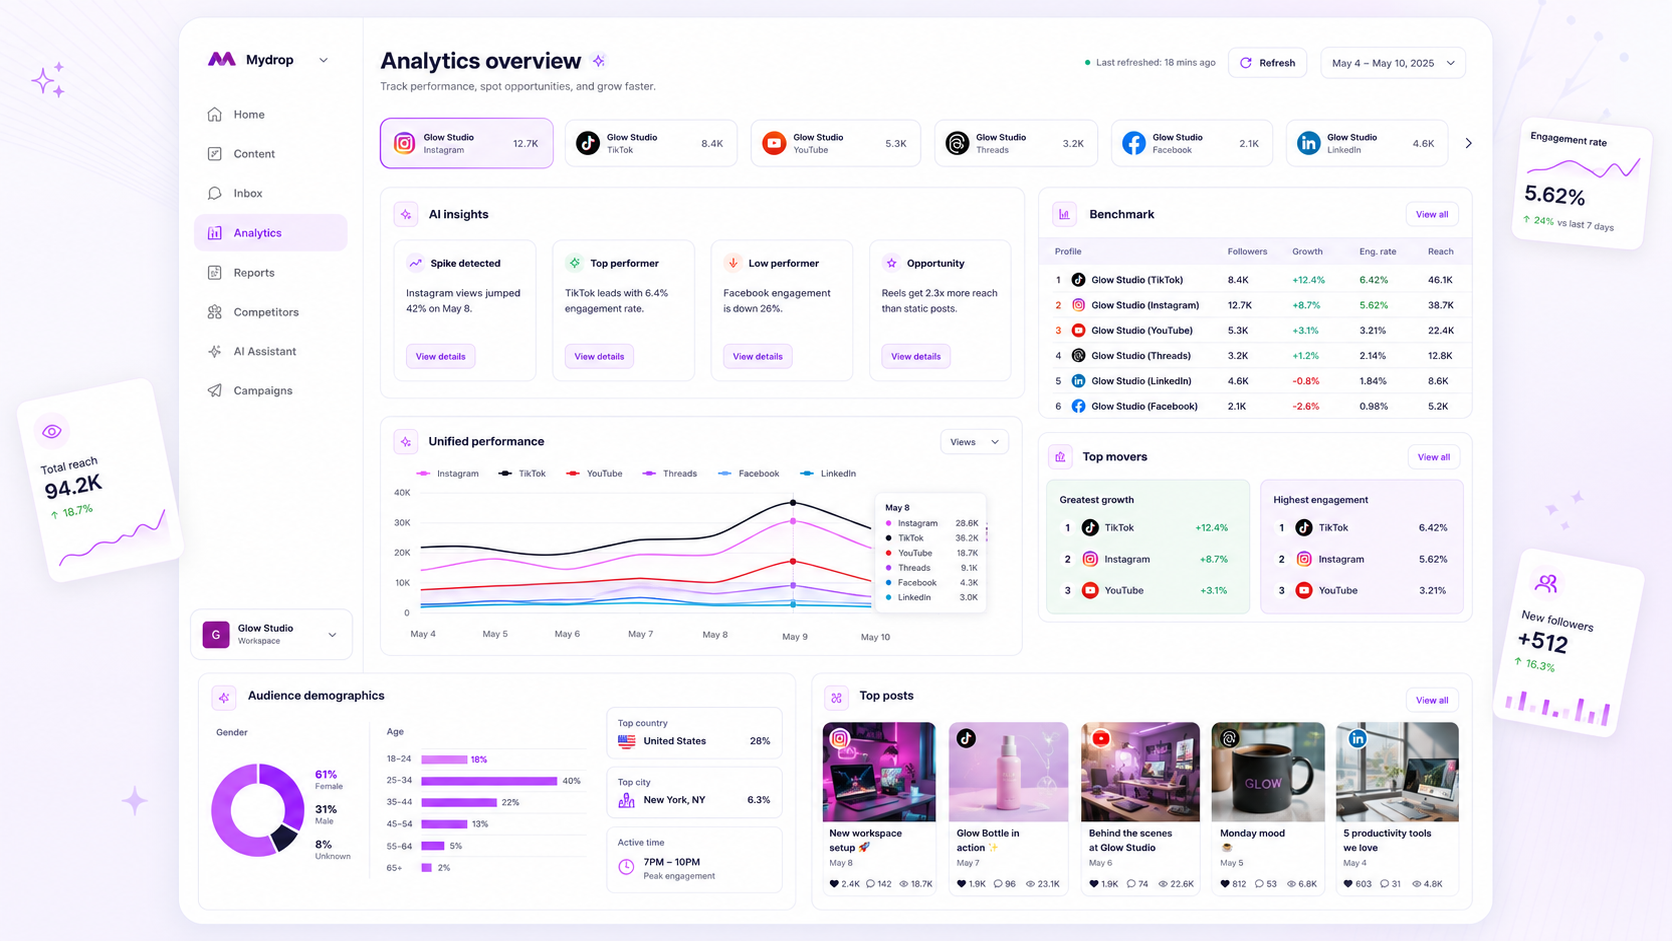
At Mydrop, we see teams fall into this trap constantly. They treat the high-level benchmark as if it needs constant, manual validation. In reality, your systemic platform metrics-reach, impressions, and follower growth trends-should be automated. Set these to a daily system refresh. When you walk into the office, the data should be there waiting for you, cached and ready. You should never waste your morning coffee-time waiting for an API to ping.
Everything else? That stays manual.
Deep-dives into specific profile subcollections are inherently tactical. You only enter that zone when the benchmark signals a drift. If your aggregate platform engagement holds steady at 3.2% but your "Lifestyle Brand" profile suddenly dips to 1.8%, that is a surgical problem. That is when you stop looking at the high-level dashboard and start drilling into the specific assets, copy hooks, and posting times of that one account.
Decision check: Never manually refresh a dashboard to answer a "what" question. Use the automatic cache for the "what," and save your manual energy for the "why."
The tradeoff matrix
Choosing the wrong tool for the task is like trying to fix a watch with a sledgehammer. You might break the glass, but you definitely won't fix the spring. Use this matrix to stop the context switching before it eats your week.
| Diagnostic Task | Scope | Primary Value | Mydrop Workflow |
|---|---|---|---|
| Systemic Health | Cross-Profile | Baseline Stability | Check Analytics Dashboard (Automated cache) |
| Creative Audit | Single-Profile | Content Efficacy | Drill into Result Subcollections (Manual analysis) |
| Market Shift | Multi-Platform | Trend Correlation | Compare Benchmark Summaries (System refresh) |
| Crisis/Spike | Ad-hoc | Immediate Context | Trigger Manual Refresh (For current-day data) |
If you are looking at more than five profiles at once, do not touch the subcollections. Stick to the benchmark summaries. If you are trying to optimize the creative for a single launch, do not look at the global dashboard. The broad metrics will only obscure the creative signal you need to see.
The most disciplined teams we work with have a simple agreement: Monday is for benchmarks, Wednesday is for audits. By decoupling these, they prevent the panic that happens when someone sees a dip in a single account and assumes the entire brand strategy is collapsing.
Most teams do not have a content problem. They have a decision bottleneck. By formalizing whether you are in "monitoring mode" or "surgery mode," you stop guessing and start executing. Before you open another tab, ask yourself: Am I looking for a systemic signal, or a local fix? If you can answer that, you have already saved an hour of your day.
How to pilot the workflow safely
You do not need to overhaul your entire department by Monday morning to see the benefits of separating systemic benchmarks from profile-specific audits. Start by running a two-week pilot with one of your more agile brand teams.
- Assign the Benchmark Lead: Designate one person each Monday morning to spend 15 minutes in your Mydrop Analytics dashboard. Their job is not to fix anything, but to report the "system signal"-is reach up, down, or flat across the portfolio?
- Define the Trigger: Agree on what "outside expected threshold" means for your team. If your average engagement benchmark is 3%, any single profile dropping below 1.5% for two consecutive days triggers a deep-dive audit.
- Audit the Creative, Not the Platform: When a profile fails that trigger, resist the urge to blame the algorithm or the platform API connection. Instead, use the profile-specific results subcollections to look for internal culprits: was the asset format wrong? Did the copy deviate from the brand voice? Was the posting time off-peak?
By keeping the "system signal" in the main dashboard and moving the "deep-dive" to the profile results, you avoid the common trap of manually auditing every single account every single day. You will find that 80% of your accounts are actually performing exactly as they should, allowing your team to focus their energy on the 20% that are genuinely stumbling.
The operating rule to keep
To keep your team from sliding back into the habit of manual, firehose-style reporting, anchor your work in this simple principle: Never audit what you cannot explain with a benchmark.
Workflow check: If a profile’s performance dips, check the multi-profile benchmark first. If the whole platform is down for everyone, it is a system issue. If only that profile is down, it is an execution issue. Stop digging until you have that answer.
When you support hundreds of brand profiles, the temptation to "check everything" is a symptom of coordination debt, not diligence. It is the administrative equivalent of checking the lock on your front door fifty times before leaving for work. Trust the dashboard to provide the high-level pulse, and trust your team to do the heavy lifting only when the pulse shows a clear irregularity.
Conclusion
The difference between a frantic team and an efficient one is rarely the amount of data they have, but rather their discipline in knowing what to ignore. When you stop treating the Analytics dashboard as a place to go hunting for problems and start using it as a diagnostic tool for prioritizing your team’s time, you move from being reactive firefighters to proactive operators.
You have the tools to see what is happening across your entire portfolio. Use them to separate the noise of a bad day on the platform from the signal of a genuine creative bottleneck. By shifting your rhythm to benchmark first and drill down second, you reclaim the hours previously lost to manual reporting and turn your data back into what it was always supposed to be: a map for your next move.