The most effective way to track social media performance isn't waiting for a Monday morning report; it is relying on a daily-refreshed, cached analytics dashboard. When your data is tethered to a manual weekly cadence, your team is constantly operating on last week’s trends, treating campaigns like post-mortems rather than active, fluid projects. In high-stakes enterprise environments, that reporting lag isn't just an inconvenience, it is a strategic liability that turns your analytics tool into a glorified document generator instead of a command center.
We have all been there. You spend your Friday afternoon compiling stats, only for the insights to be stale the moment they hit a stakeholder’s inbox. You want to move fast, but you are stuck waiting for the numbers to catch up to the reality of the campaign. It is exhausting, and it kills the very data-driven culture you are trying to build. You do not need another static report. You need a persistent, reliable pulse on your brand's footprint across every market and channel.
What the best tools need to handle

When you are managing dozens of profiles across Facebook, TikTok, LinkedIn, and X, you cannot afford to manually trigger API calls or fight with cooling-off periods just to see if a post is landing. Enterprise analytics must be built for continuous visibility, not periodic check-ins.
| Feature | Manual Reporting Cycle | Automated Daily Refresh |
|---|---|---|
| Data Freshness | Stale (usually 7+ days old) | Current (ending yesterday) |
| Team Effort | High (manual compilation/export) | Zero (system-handled) |
| Agility | Reactive (post-mortem) | Proactive (in-flight tuning) |
| Consistency | Variable (human error prone) | High (standardized metrics) |
The best tools in this space do not just show data; they handle the heavy lifting of caching. At Mydrop, we see teams struggle most when their dashboard forces them to manually refresh each profile individually. If your dashboard takes three minutes to load while it polls every API, you simply will not check it when you have ten minutes before a status call.
Operator rule: If your analytics dashboard requires manual intervention to be relevant, you do not have an analytics tool; you have a data-entry bottleneck.
To handle enterprise scale, your dashboard must normalize metric families across platforms. You need to see engagement, reach, and video views in a single view, regardless of whether the source is a LinkedIn post or a TikTok video. If the tool fails to normalize these, or if it hides metrics behind API access errors without surfacing clear provider feedback, your team loses hours reconciling columns instead of making decisions.
The most critical test is how it handles the last 30 days view. It must be consistently cached and ready the moment you open the app, providing a reliable snapshot of profile health. Anything less forces you back into that familiar, frustrated cycle of refreshing, waiting, and hoping the numbers are finally updated.
Where basic tools start to break

You know that moment when you are trying to pull a quick performance report for a client, and the tool just spins, times out, or reminds you that you have exceeded your daily API quota? That is not just a technical hiccup; it is a workflow killer. When your data access is tethered to manual, on-demand requests, you are essentially flying with a dashboard that only updates when you remember to press a button.
The most common point of failure for basic tools is manual refresh dependency. If your analytics tool requires you to actively initiate an API call for every profile before you can see updated metrics, you have already lost. For a team managing a handful of accounts, this is a nuisance. For an agency or a multi-brand company managing dozens or hundreds of profiles across platforms like LinkedIn, TikTok, and Google Business Profile, it is a structural disaster.
Basic platforms also struggle with data fragmentation. They often present metrics in silos, forcing your team to manually synthesize cross-profile benchmarks in external spreadsheets. When the tool does not automatically cache, normalize, and reconcile these data points, your team spends more time acting as human ETL pipelines-copying, pasting, and formatting-than actually analyzing the results.
At Mydrop, we often see teams hit a ceiling because their tools are designed for single-user, single-brand environments. When you support thousands of users, those fragile on-demand API fetches start to crumble under the volume. A tool that fails to maintain a cached, daily-refreshed state is not just inconvenient; it is actively preventing your team from seeing the real-time pulse of your social media operations.
The buying criteria that matter
When you are evaluating analytics tools, stop asking what metrics they track. Everyone tracks likes and views. Start asking how they track and present them. You need to assess whether a tool is built to handle the operational reality of an enterprise team.
Use the following scorecard to audit any platform you are considering. If a tool cannot check these boxes, it will struggle to support a data-driven culture as your team grows.
| Feature | The Enterprise Standard | Why It Matters |
|---|---|---|
| Data Architecture | Automated, cached daily refresh | Eliminates manual button-smashing and API rate-limit anxiety. |
| Refresh Logic | Intelligent, system-driven cadence | Ensures data is ready before your team starts their day. |
| Normalization | Unified, cross-platform metrics | Allows you to compare performance across LinkedIn, X, and TikTok easily. |
| Error Handling | Transparent "Missing Data" states | Prevents false-zero reporting when API access is restricted. |
| Benchmark Depth | Aggregate, workspace-wide views | Lets you spot viral moments or red flags across all managed profiles. |
Your Decision Checklist
Beyond the scorecard, apply these three rules to ensure the tool fits your actual workflow:
- Check for "Set and Forget" Automation: Does the tool automatically refresh metrics in the background, or does it require a user to log in and initiate the process? An enterprise tool should work for you overnight.
- Verify Cross-Profile Comparison: Can you pull a single view that benchmarks engagement across different brand profiles? If the tool forces you to navigate to each profile individually, it is not optimized for agency or multi-brand scale.
- Evaluate Permission Handling: How does the tool handle restricted metrics (like X Premium requirements)? A mature tool explicitly flags missing or restricted data, ensuring your reports are accurate and you don't mistakenly report an empty metric as a zero-performance result.
While Mydrop is built specifically to address these enterprise bottlenecks, the core principle holds true regardless of the platform: social media scale usually fails from coordination debt, not a lack of ideas. If your analytics workflow relies on manual intervention, you are not managing performance; you are just keeping track of the past.
How Mydrop supports this workflow
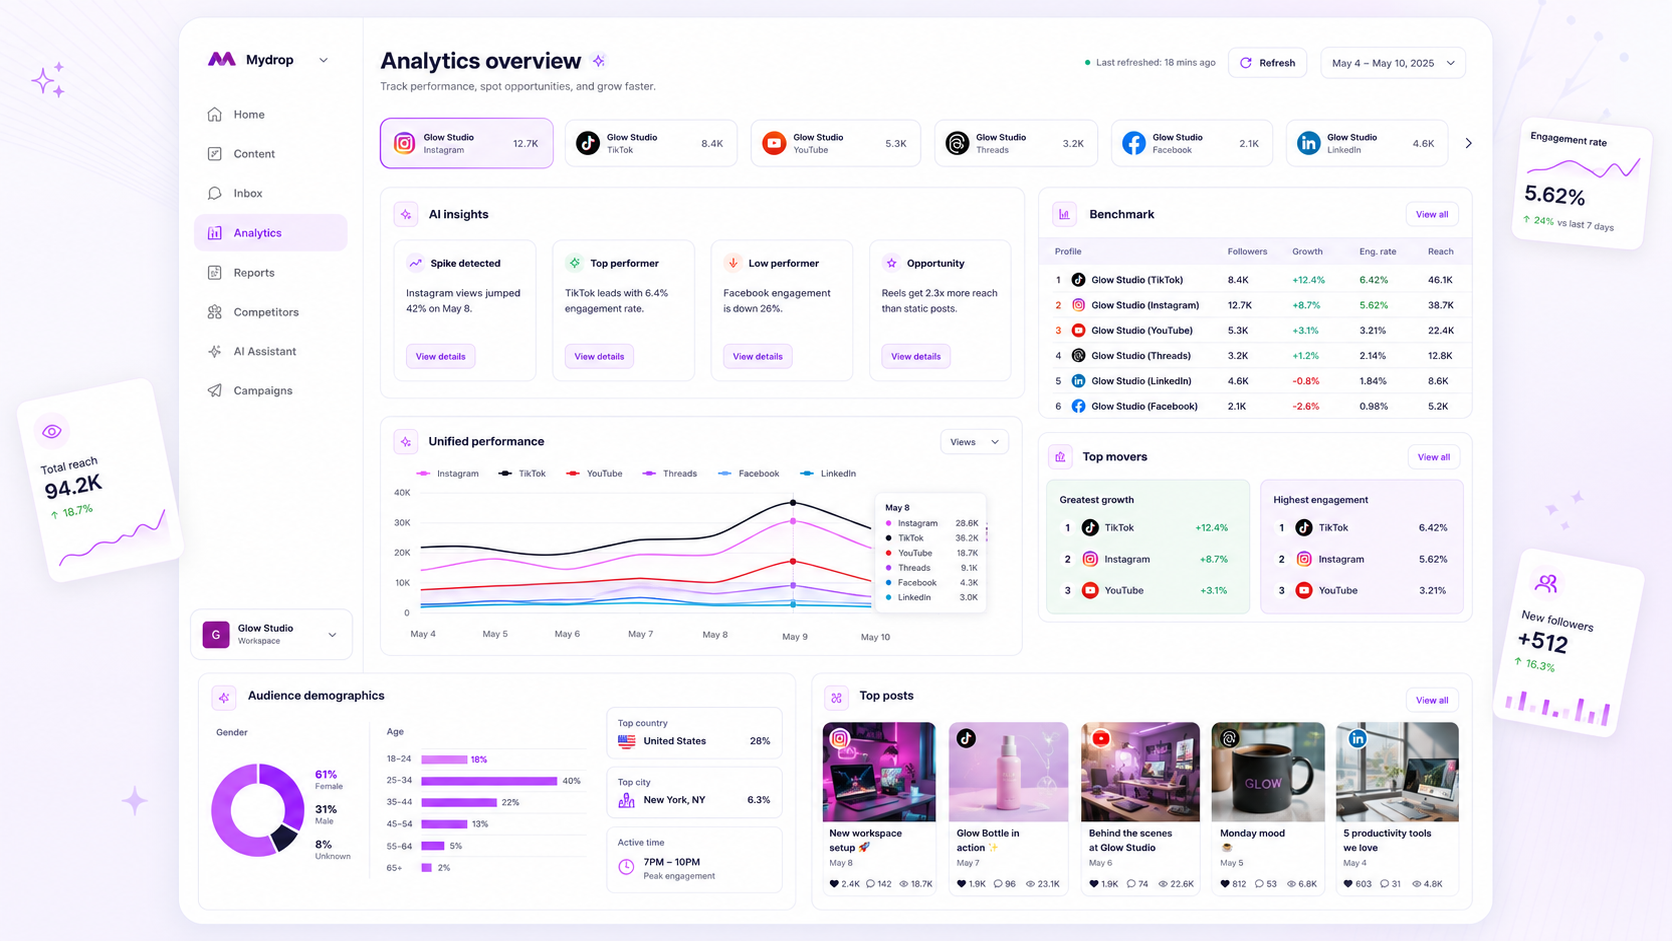
At Mydrop, we designed our Analytics Dashboard to act as that real-time pulse. By utilizing a cached workspace architecture, we store the latest performance snapshots across all connected profiles, meaning your dashboard loads instantly without waiting for live, platform-by-platform API calls every time you log in. The system handles the daily automated refresh for you, so your team starts every morning with data that is relevant to yesterday's results.
If a campaign suddenly spikes on Threads or LinkedIn, you can trigger a manual refresh for that specific profile to see the latest impact before your afternoon stand-up. We see this shift from reactive reporting to proactive management as the biggest differentiator for high-performing teams. It moves the conversation away from "why did the report look like this last Monday" and toward "here is what we need to adjust for tomorrow."
A simple shortlist checklist
Before you commit to a new platform or double down on your existing setup, run this audit against your current analytics tool.
| Criteria | Essential Enterprise Requirement | Why it Matters |
|---|---|---|
| Refresh Cadence | Daily automated sync as base | Eliminates manual "compile time" bottleneck |
| Cache Architecture | Pre-loaded dashboard views | Instant access even for large portfolios |
| Manual Overrides | On-demand refresh lock/cooldown | Allows "in-flight" correction for viral moments |
| Cross-Platform | Unified benchmark metrics | Breaks siloes between TikTok, X, and LinkedIn |
Decision check: If your team spends more time formatting data than interpreting it, you have a process issue, not a lack of data.
Stop treating your analytics dashboard like a monthly tax audit. It is a living map of your campaign's health. If you are stuck staring at last week's numbers, you are driving by looking in the rearview mirror. Take these criteria, audit your current stack, and demand better from your tools. Your team deserves to spend their energy making better creative decisions, not nursing a spreadsheet. It is time to let the automation handle the heavy lifting of data collection so you can actually do the work you were hired for.