
Stop treating your reporting dashboard like a storage locker for every data point the platform API provides. You should report on Impressions when your primary goal is Brand Awareness, and Clicks when you are executing a Direct Response campaign. If your stakeholders are constantly asking "what does this mean?" for every campaign, it is because you are handing them raw numbers instead of a strategic signal.
We know the drill. You spent all week fighting for approval in messy email chains, the agency is waiting on feedback, and now you have to report on "success" to a leadership team that doesn't care about click-through rates; they care about ROI. The data is overwhelming, and the coordination debt is real. When you present impressions and clicks with equal weight, you signal that you haven't decided what actually matters.
Here is where teams usually get stuck: they mix top-of-funnel reach goals with bottom-of-funnel conversion metrics, effectively asking their leadership to do the math for them. At Mydrop, we see this across thousands of posts. When you don't anchor your report to a single goal, you leave the door open for every stakeholder to apply their own subjective filter to your work. A simple rule helps: the metric must match the intent of the asset, not just the availability of the data.
The decision each metric should trigger

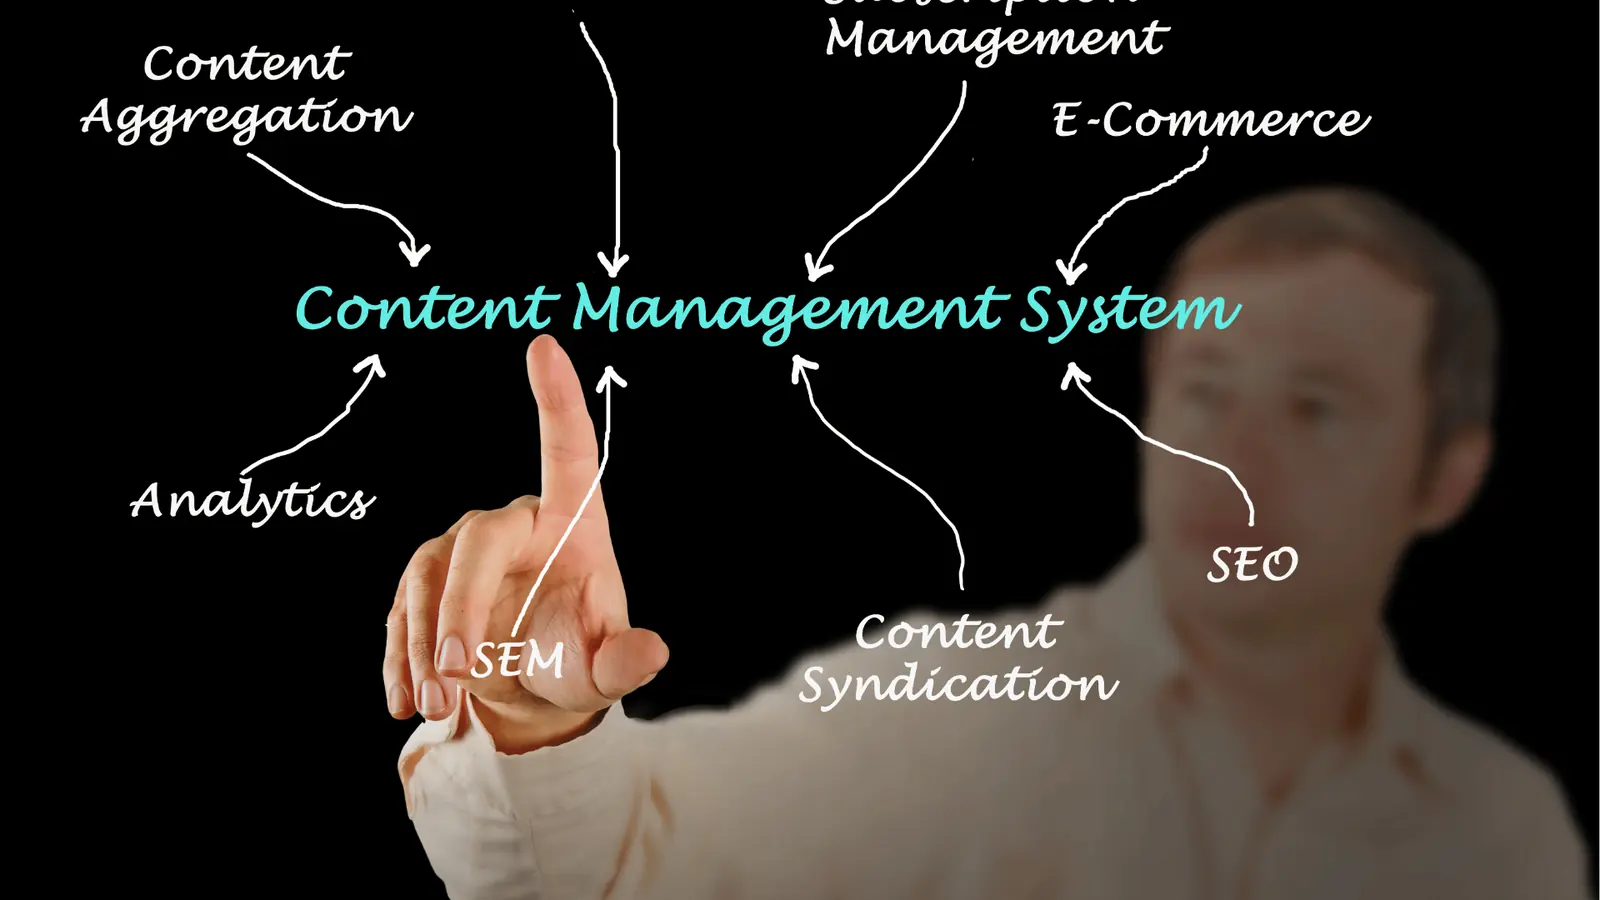
Most reporting failures happen because the team lacks a clear internal handshake on what a campaign is trying to move. Impressions and clicks are not just numbers; they are diagnostic signals for different parts of your marketing engine.
Operator rule: If your goal is to change perception, report on reach. If your goal is to change behavior, report on action.
Use this decision matrix to determine exactly which metric belongs in your executive summary before you build the slides.
| Campaign Intent | Primary Diagnostic | Operational Action |
|---|---|---|
| Brand Awareness | Impressions / Reach | Optimize creative assets for visual stopping power. |
| Direct Response | Clicks / CTR | Optimize call-to-action placement and landing pages. |
| Community Growth | Engagement Rate | Optimize content for conversation and saves. |
When you treat your dashboard as a triage tool rather than a storage container, you stop the reactive fire-drill of explaining low clicks on an awareness-focused video. If you see high impressions but low clicks on a direct-response ad, you have already identified exactly where to focus your next iteration. You aren't guessing; you are running an audit.
This is the part most teams underestimate: when you define these metrics before the campaign launches, you remove the ambiguity that allows stakeholders to move the goalposts mid-quarter. We often see teams fix this coordination debt by attaching clear goals to their posts within their workflow. That way, when it comes time to report, you know exactly why certain assets were chosen-and more importantly, you know exactly which metric serves as the proof of your strategy.
The scorecard that keeps reporting useful

Stop dumping every available data point into your monthly slide deck. Your leadership team is not looking for a data archaeology project; they are looking for a pulse on the business. If they have to ask what a metric implies, your report has already failed.
The fix is a High-Signal Scorecard. This isn't a comprehensive audit of every platform API output. It is a curated, quarterly-aligned document that maps your tactical output to your executive goals.
| Component | Metric | Diagnostic / Context | Action Threshold |
|---|---|---|---|
| Brand Goal | Impressions | Audience Growth Rate | Adjust creative if < -5% MoM |
| Action Goal | Click-Through Rate | Cost Per Click (CPC) | Pause underperformers if CPC > 2x goal |
| Engagement | Interaction Rate | Top performing theme | Pivot content mix based on wins |
In our experience, the most effective teams treat the scorecard as a living contract. You define the primary success metric before the campaign launches, not after the data is exported.
Decision check: If a metric cannot be tied to a specific "do or stop" decision, remove it from the report. If you do not know what you would do differently based on a number, that number is noise.
When you use a tool like Mydrop, you can attach approval context to your post workflow. This is a game-changer for reporting because when a stakeholder asks why a certain asset was chosen or why a specific hook was tested, you already have the "why" pinned to the post itself. You spend less time explaining history and more time analyzing performance.
What to stop measuring by default
The most common trap we see in enterprise marketing is the obsession with "volume" metrics. Reporting on 5 million total impressions across 50 markets feels productive, but it is often just vanity. It hides the fact that most of those impressions were fleeting, irrelevant, or delivered to segments that do not impact your bottom line.
Stop reporting these metrics as primary KPIs:
- Follower count (The "nice-to-have"): Unless you are building an audience from scratch, this rarely correlates with quarterly business outcomes.
- Total "Likes" (The vanity trap): High like counts can signal engagement, but they are often disconnected from purchase intent. They are a proxy for "I saw this," not "I care about this."
- Raw engagement numbers (The contextless void): 10,000 engagements look great, but if they came from a single giveaway post that drove zero traffic to your site, they are a distraction from your actual marketing work.
This is the awkward truth: Most teams do not have a content problem. They have a coordination debt problem. They are so busy churning out enough "volume" to keep the impression numbers high that they lose the ability to actually measure the intent behind those clicks.
When you strip away the vanity, you are left with two categories: those that measure your brand footprint and those that measure your tactical execution. Everything else is just clutter. If you find yourself manually compiling these vanity numbers every Friday, you have bigger operational problems than your dashboard can solve. Start by defining your "must-have" metrics for the month, and force yourself to delete everything else. You will be surprised by how much trust you gain from your leadership when you present a clean, decisive view of what matters.
How to connect metrics to next actions
The reason your team feels like they are running on a hamster wheel is that they are treating analytics as a historical record rather than a set of instructions. If a campaign hits its impression goal but misses on clicks, your next action isn't to report the "failure" to leadership; it is to adjust the creative for the next flight.
Metrics should trigger specific operational pivots. If you aren't changing the work based on the data, you aren't managing a campaign-you are just documenting its funeral.
At Mydrop, we suggest using Calendar reminders to bake this review into your actual production schedule, rather than treating it as a "whenever we get to it" task. When you attach a reminder to a campaign workflow, you ensure that the analytics review happens in the same window you use to plan the next set of assets.
Here is how to map your metric findings to specific tactical moves:
| Finding | Tactical Pivot |
|---|---|
| High Impressions / Low Clicks | Swap the CTA button text, simplify the landing page, or tighten the creative hook. |
| High Clicks / Low Conversion | Review the landing page experience, check for technical friction, or adjust the offer. |
| Low Impressions / High Engagement | Increase spend, test new audience segments, or shift the publishing window to prime time. |
| High Impressions / High Click-Through | Scale the top-performing creative across secondary markets or "lookalike" audience segments. |
Workflow check: Never present a metric in a meeting without attaching a "so what?" action item. If you cannot explain what you are going to change because of the data, omit the data.
The review cadence that makes the model stick
Most reporting failures aren't technical; they are coordination failures. You are scrambling because the data isn't ready, the agency is still adjusting the numbers, or the brand manager hasn't given the final sign-off. When the process is chaotic, the reporting becomes defensive.
To break this, you need a recurring, automated cadence that removes the human error of manual compilation.
- Weekly Health Check (15 mins): Use a pre-built template to spot-check for technical flags (like broken links or failed formats) using your platform's pre-publish validation tools. Fix the errors before they show up in the report.
- Monthly Strategy Review (60 mins): This is where you pull the "Metric Intent Matrix" from our previous section. Focus only on the primary goal of the campaign. Ignore the noise.
- Quarterly Retrospective: Use this time to look at the "big picture" trends. Did we move the needle on brand sentiment, or did we just cycle through clicks?
If you find yourself manually pulling data every Friday, you have already lost. We recommend using automation builders to trigger reports or push data directly into your shared workspaces. This ensures that everyone-from the junior creative to the VP of Marketing-is looking at the same source of truth at the same time. It kills the "who sent the latest version of the spreadsheet?" conversation permanently.
Conclusion
The difference between a frantic social team and an effective one is rarely the volume of content. It is the clarity of the decision-making loop. Stop reporting everything. Start reporting the signals that actually change your behavior.
Most teams do not have a data problem. They have a decision bottleneck.
When you align your metrics with your goals and force that review cadence into your calendar, you stop being a conduit for raw numbers and start acting as a strategic operator. You will save your team dozens of hours a month, but more importantly, you will finally have a seat at the table where the real business decisions happen. You aren't just measuring the work anymore; you are deciding what the work is actually for.